
September Market Update

Fall Season in Full Effect
Hi Everyone,
As we move deeper into the fall market, historically one of the busiest times of the year, the Inner East Bay's housing market is showing renewed energy. While some key metrics reflect year-over-year declines, the overall picture remains encouraging. Lower mortgage rates this month, tight inventory, and strong buyer competition are setting the stage for an active fall.
The average rate on a 30-year U.S. mortgage ticked up a little bit this week, after a four-week drop that brought down borrowing costs for homebuyers to the lowest level in nearly a year. Mortgage rates are influenced by several factors, from the Federal Reserve’s interest rate policy decisions to bond market investors’ expectations for the economy and inflation.
We all know that the Inner East Bay is made up of many small neighborhoods and the data below is a summary of information from across several zip codes. If you'd like to see data that's more tailored to your neighborhood, please reach out to us directly and we will be happy to share some recent sales trends.
As always, we are here to be of service in all your real estate needs. It's never too early to reach out if you are thinking of making a move. Have a great weekend!
Warmly,
Maria, Corey, Anita and Carla

Our Active Listings

JUST LISTED
3 beds, 2 baths, 1928 sf (per public record)
A bright, charming, Craftsman home with a flexible floorplan on a lovely street
in the coveted Glenview neighborhood!

JUST LISTED
5734 Maccall St. Oakland
4+ beds, 4 baths, 2578 sf (measured)
Sublime North Oakland retreat where modern sophistication and
thoughtful design meets California living.

JUST LISTED
2204 Woolsey St. Berkeley*
3 beds, 2 baths, 1550 sf (per public record)
Blending Craftsman charm, modern upgrades, an ideal indoor-outdoor flow,
and a prime location.
*Berkeley mailing address; Oakland Tax ID
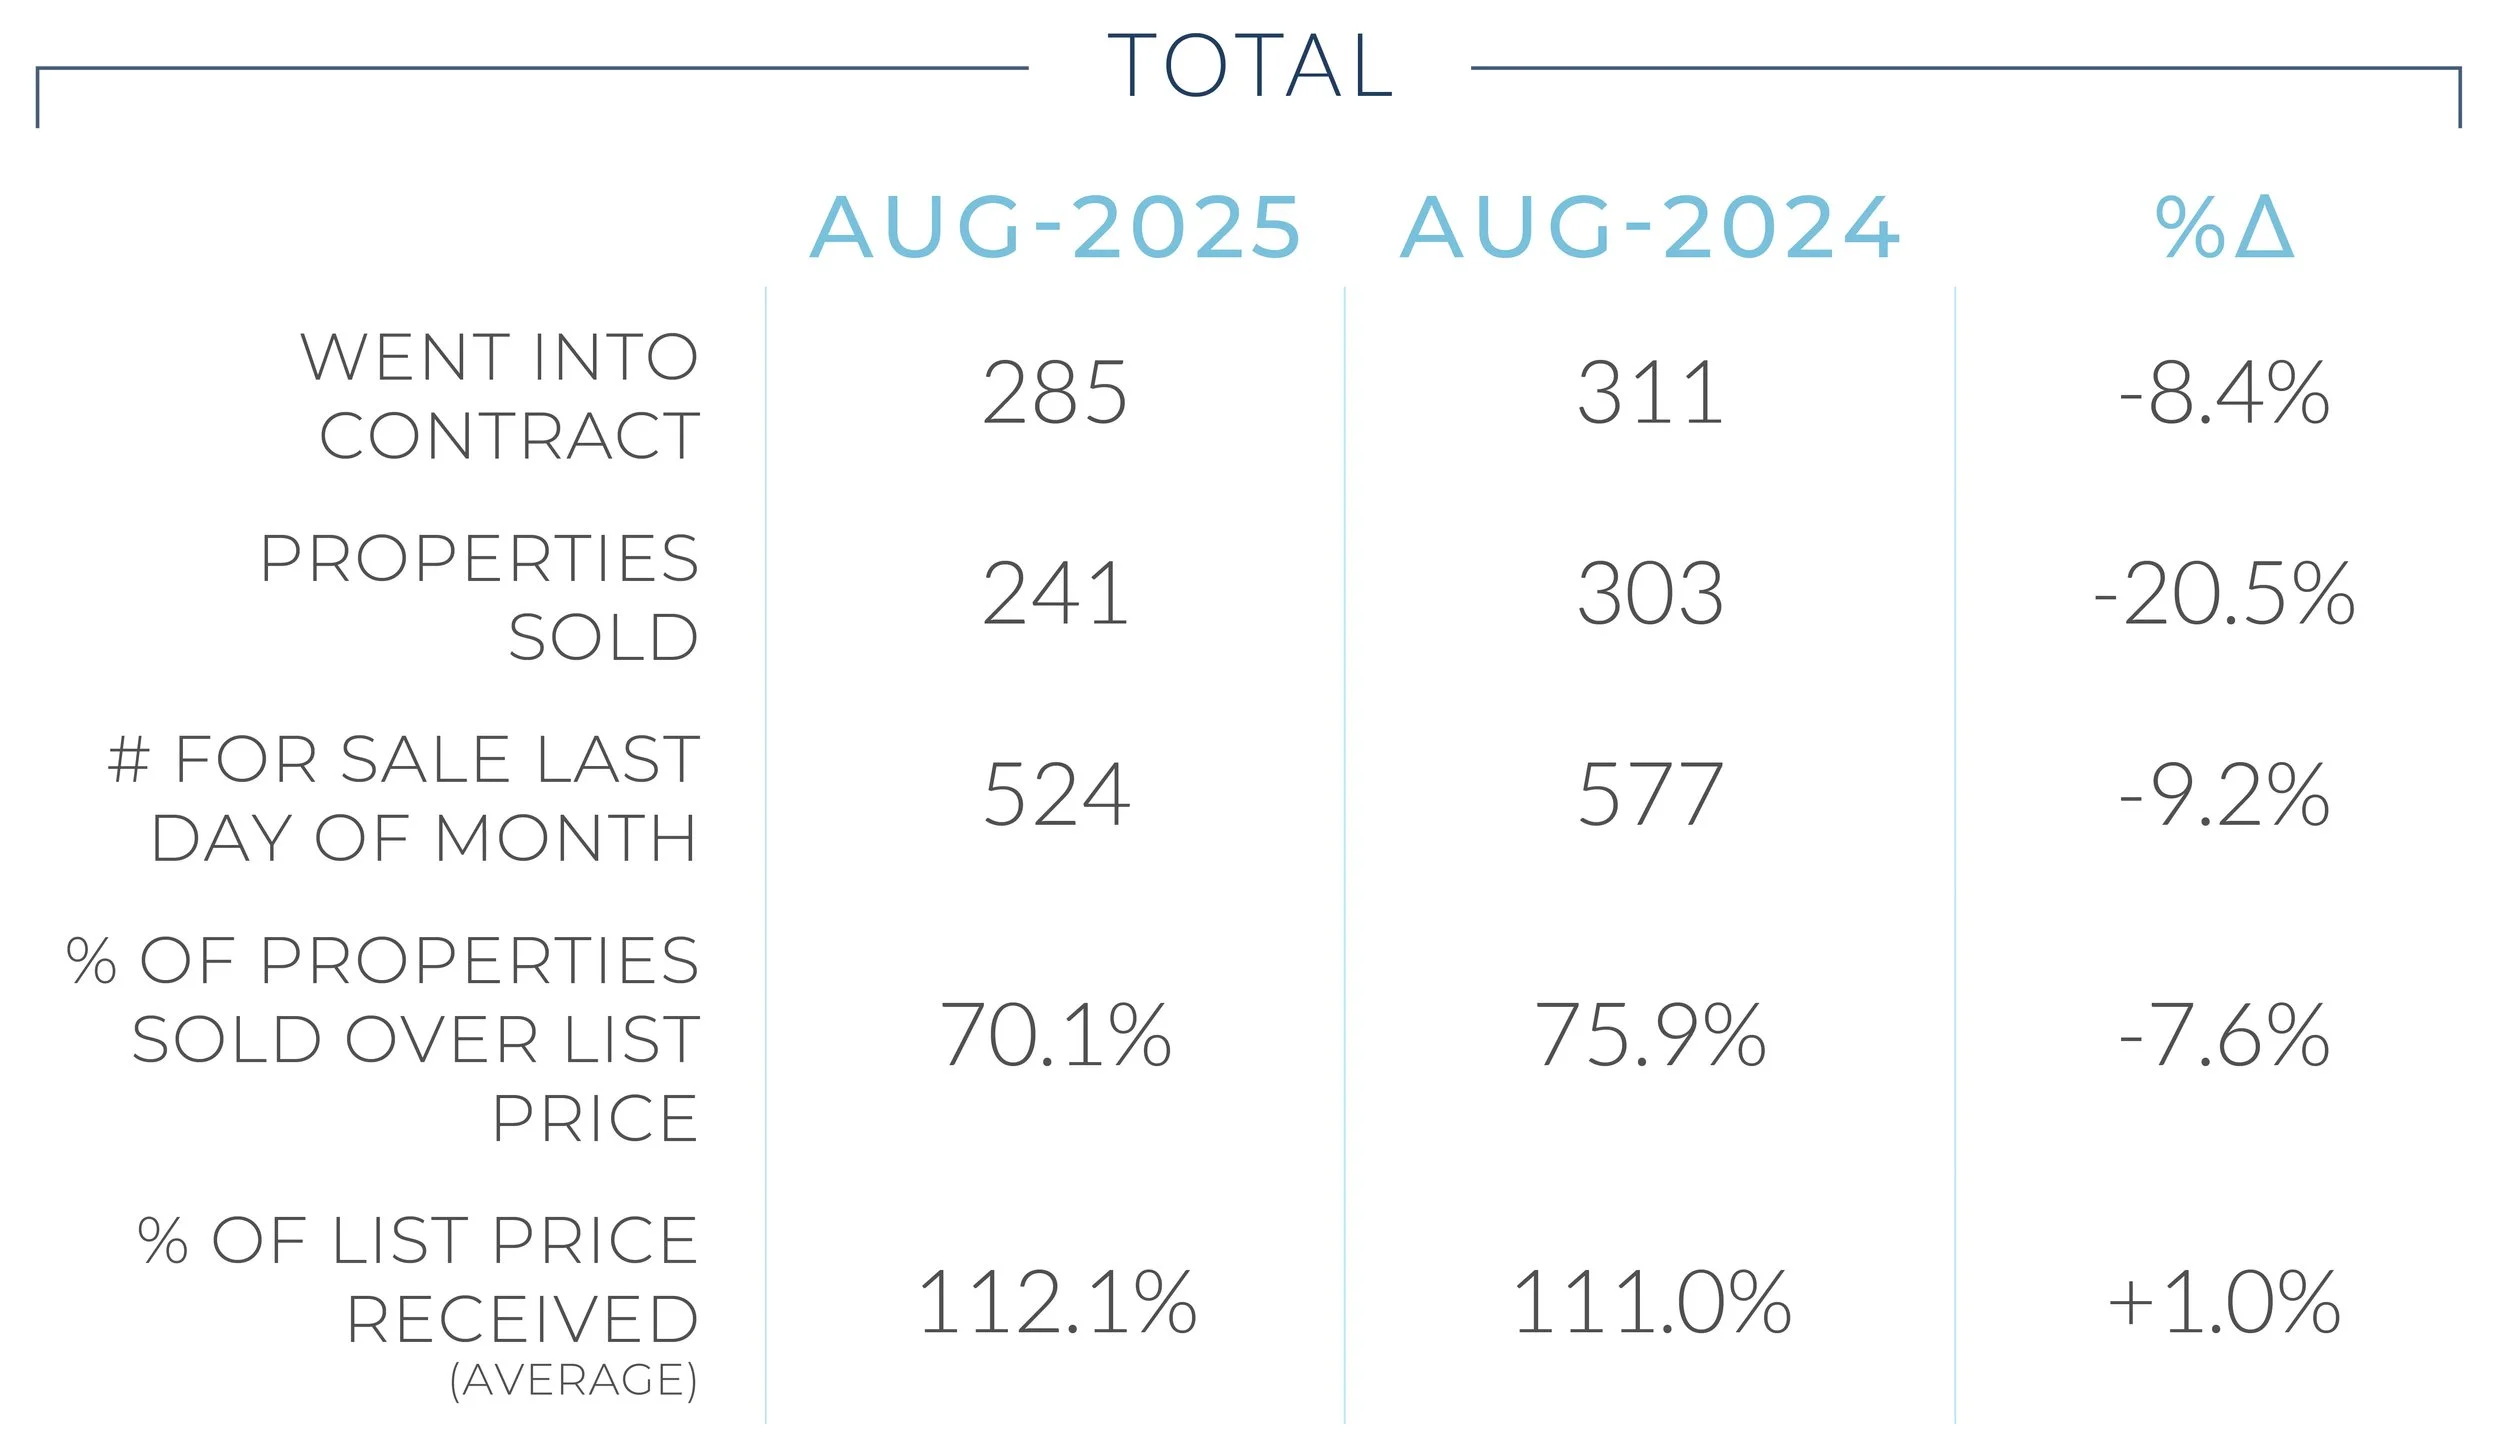
August 2025 Wrap-Up

YEAR-OVER-YEAR COMPARISON
SINGLE FAMILY RESIDENCES

MONTH-OVER-MONTH COMPARISON
SINGLE FAMILY RESIDENCES
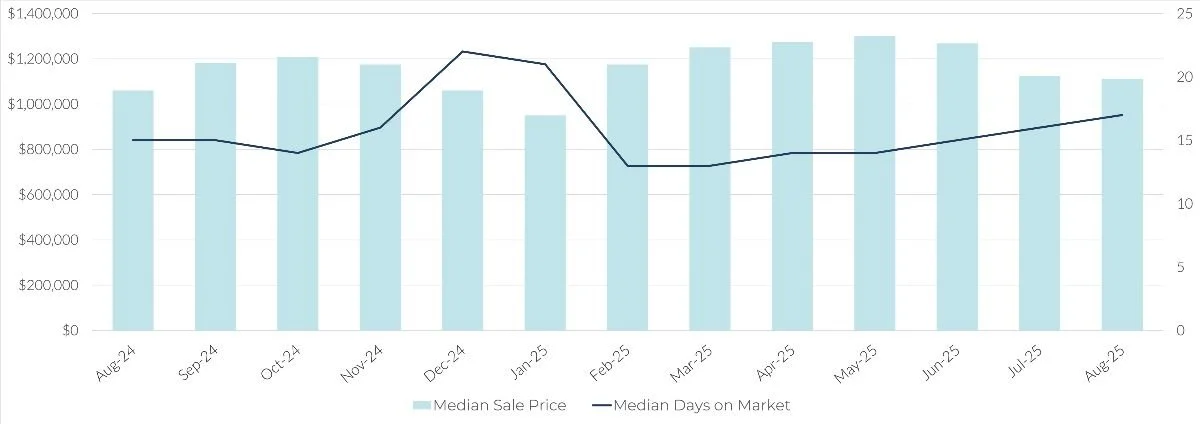
CHANGE IN PAST MONTH:
SALES PRICE
-1.3%
DAYS ON MARKET
+1 day
MEDIAN AREA VALUES
SINGLE FAMILY RESIDENCES
Q2 2025

** Denotes small sample size; Use caution when interpreting results.
YEAR-OVER-YEAR COMPARISONS
MEDIAN SALE PRICE
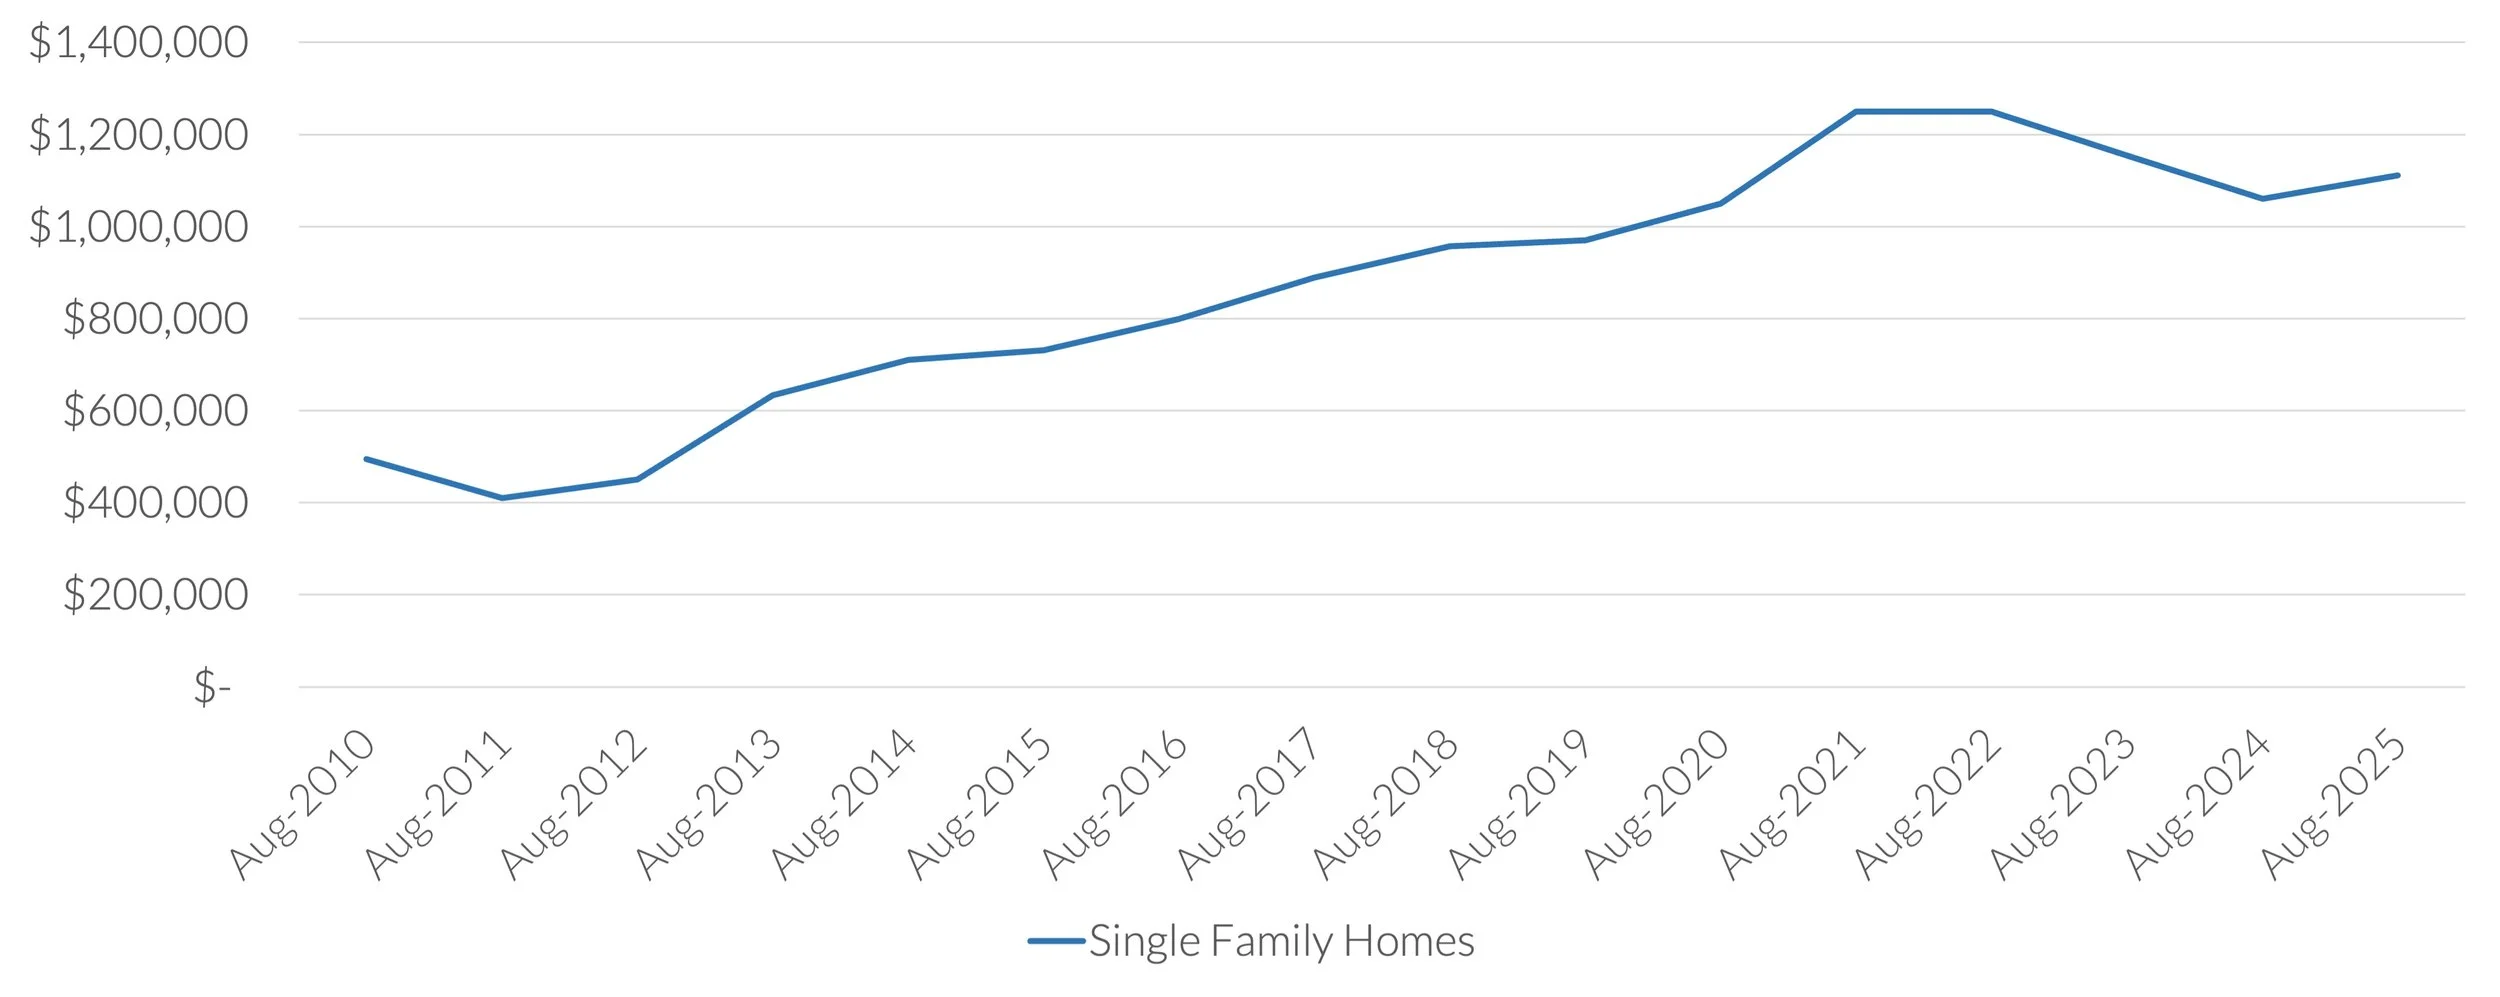
$1,110,800
+4.8% year-over-year
MEDIAN MARKET TIME

17 days
+2 day change year-over-year
NUMBER OF SALES

241
-20.5% year-over-year
SEE ALL AVAILABLE REPORTS