
July Market Update

INNER EAST BAY MARKET UPDATE
Happy July!
Summer has arrived, though here in the East Bay it feels as though spring has decided to linger a little longer this year. Between the cool, foggy mornings, green hillsides, and sunny afternoons, it’s been a beautiful season—and the real estate market has remained just as vibrant.
Usually at this time of year the market feels sleepy as folks are traveling, but open houses throughout the area continue to be busy, and many homes are still attracting multiple offers. We’ve been experiencing that firsthand–as each of our recent listings has generated strong interest and competition, and exceeded our original projections of value.
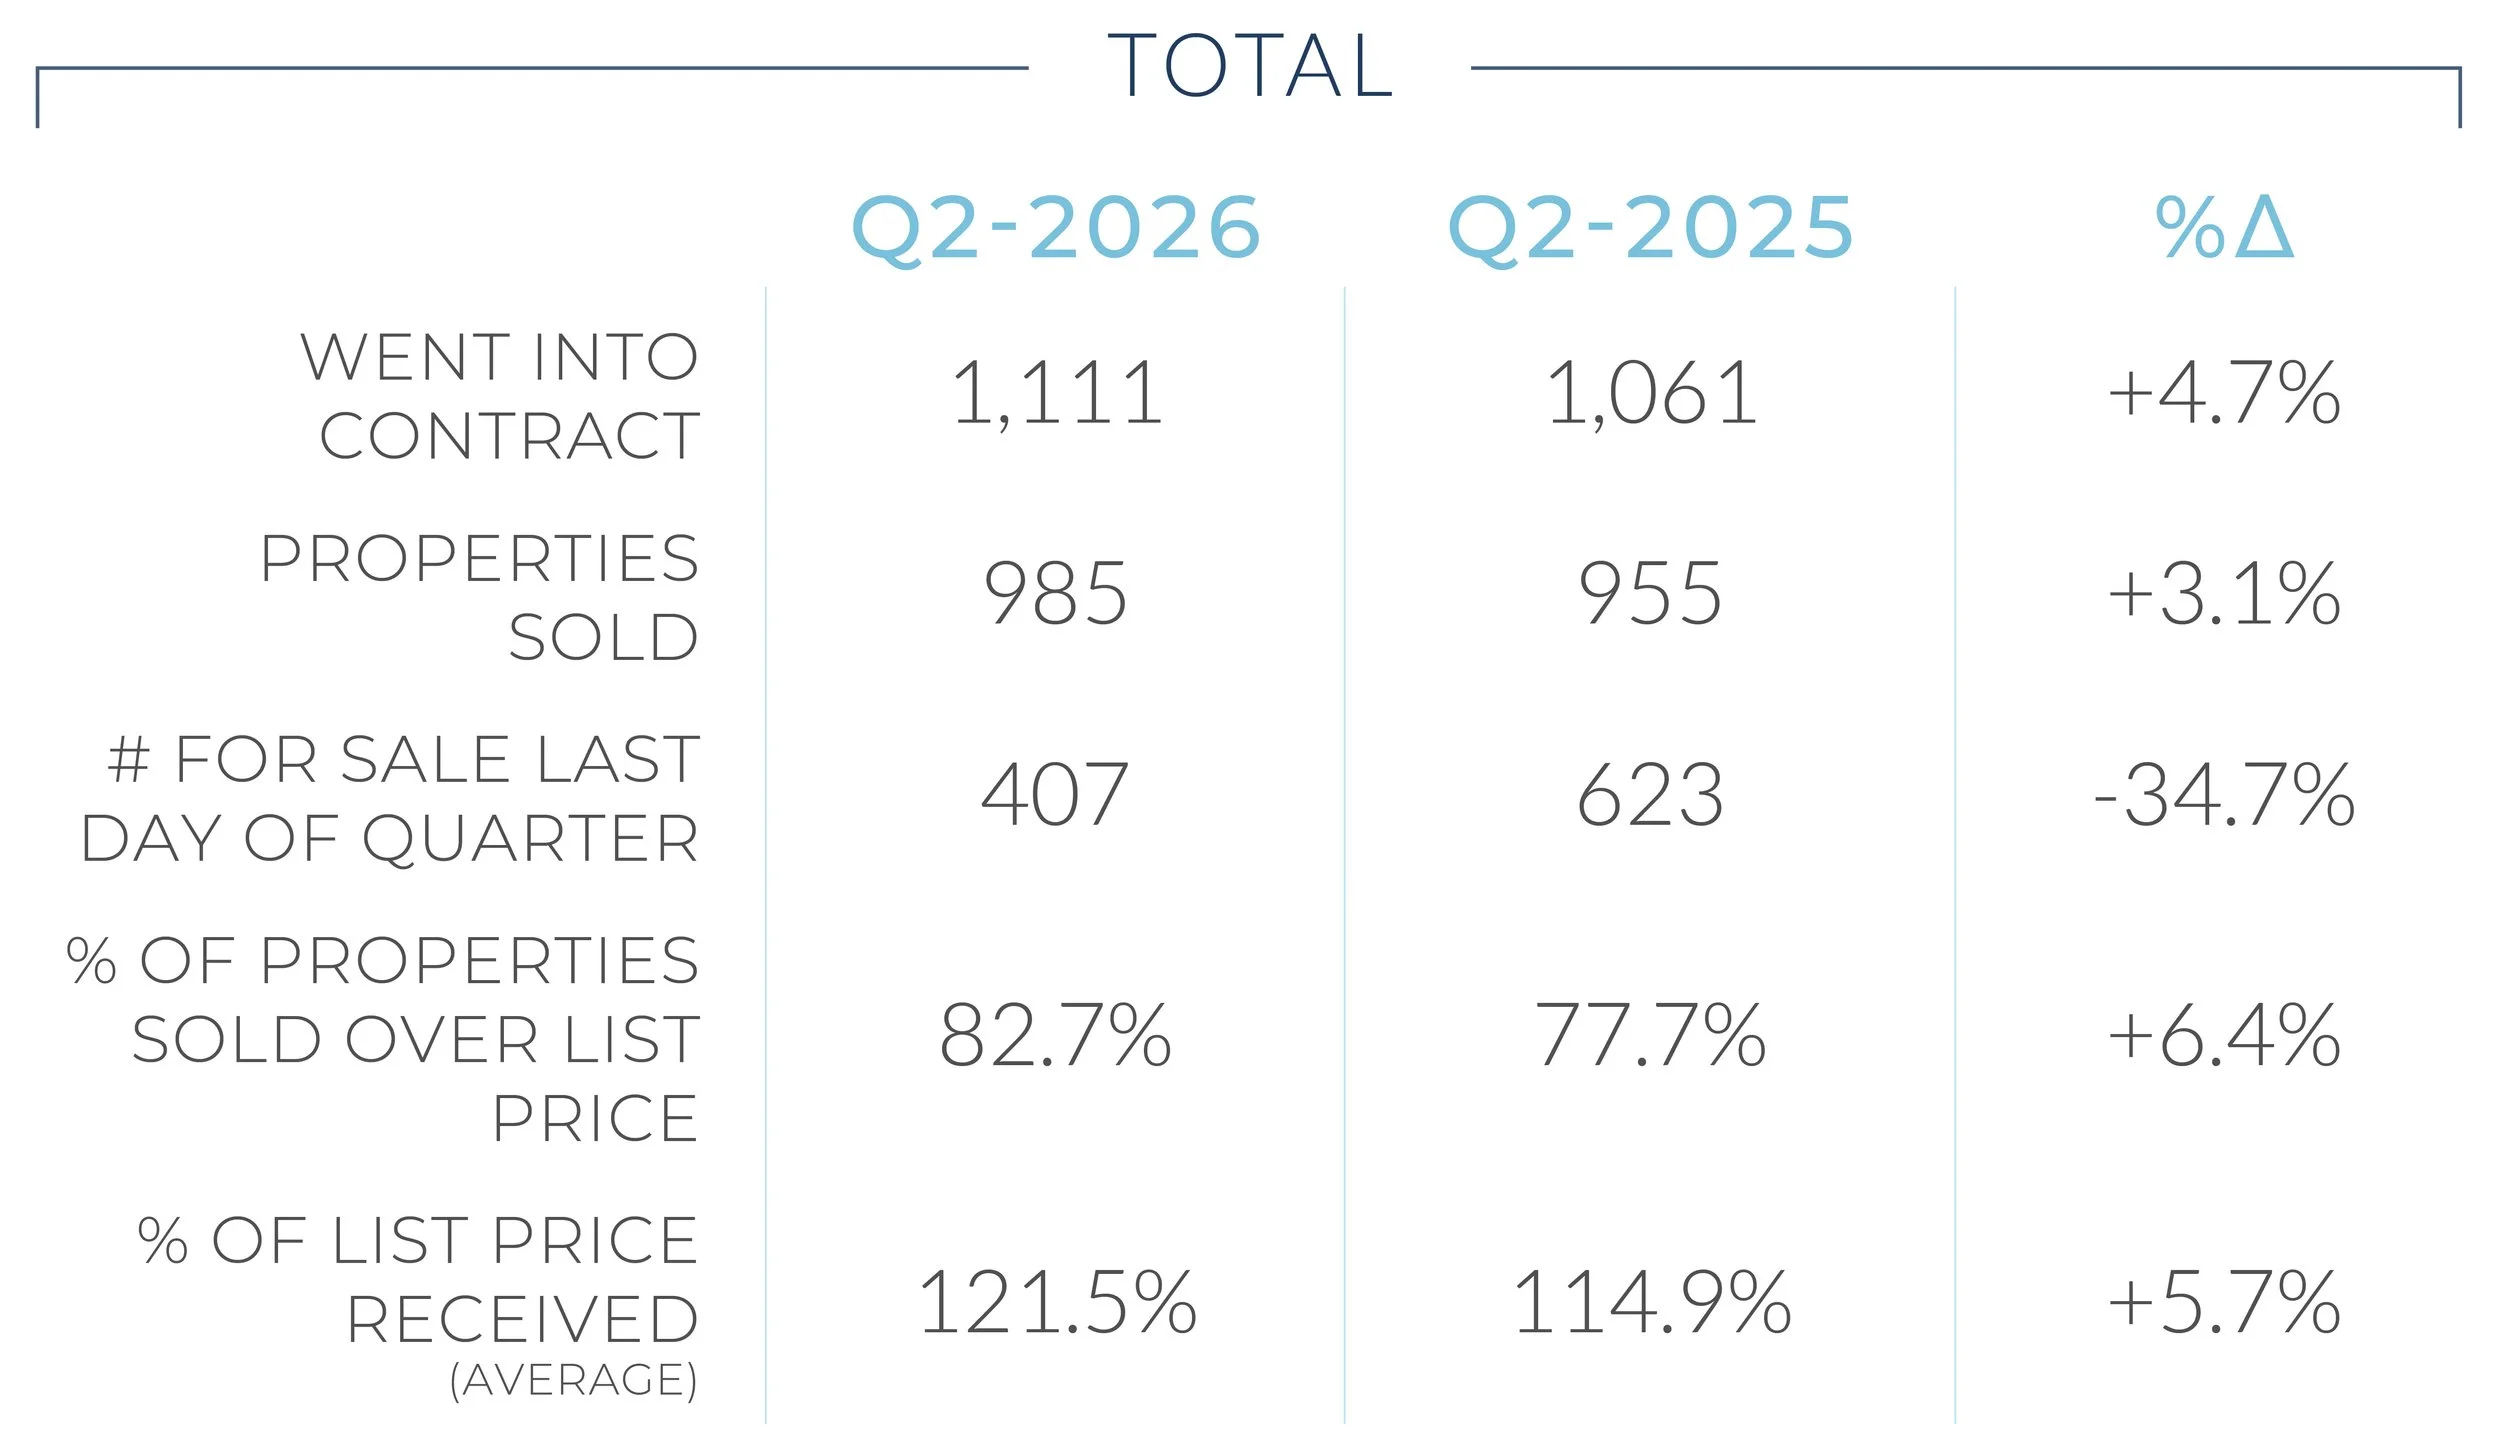
As you’ll see in the data below, the second quarter continued to show strong metrics, especially for single family homes. Inventory has remained quite low, while buyer demand has been steady, creating a dynamic sellers’ market that continues to reward thoughtful preparation and strategic pricing. Well-presented homes are moving quickly, and sellers have continued to benefit from this extended time of limited inventory.
It’s not always easy to be a buyer here, but people are still eager to put down roots in our wonderful East Bay communities, which we understand! From our beautiful and varied architecture to our expansive East Bay parks…from spectacular restaurants and abundant farmers markets, to local purveyors of the most delicious foods you can imagine…from small backyard gatherings to epic summer festivals and gatherings, and let’s not forget the temperate weather...this remains a very special place to call home!
As always, whether you’re thinking about making a move or simply curious about what’s happening in our market, we’re here as a resource for you.
Warmly,
Maria, Corey, Anita and Carla
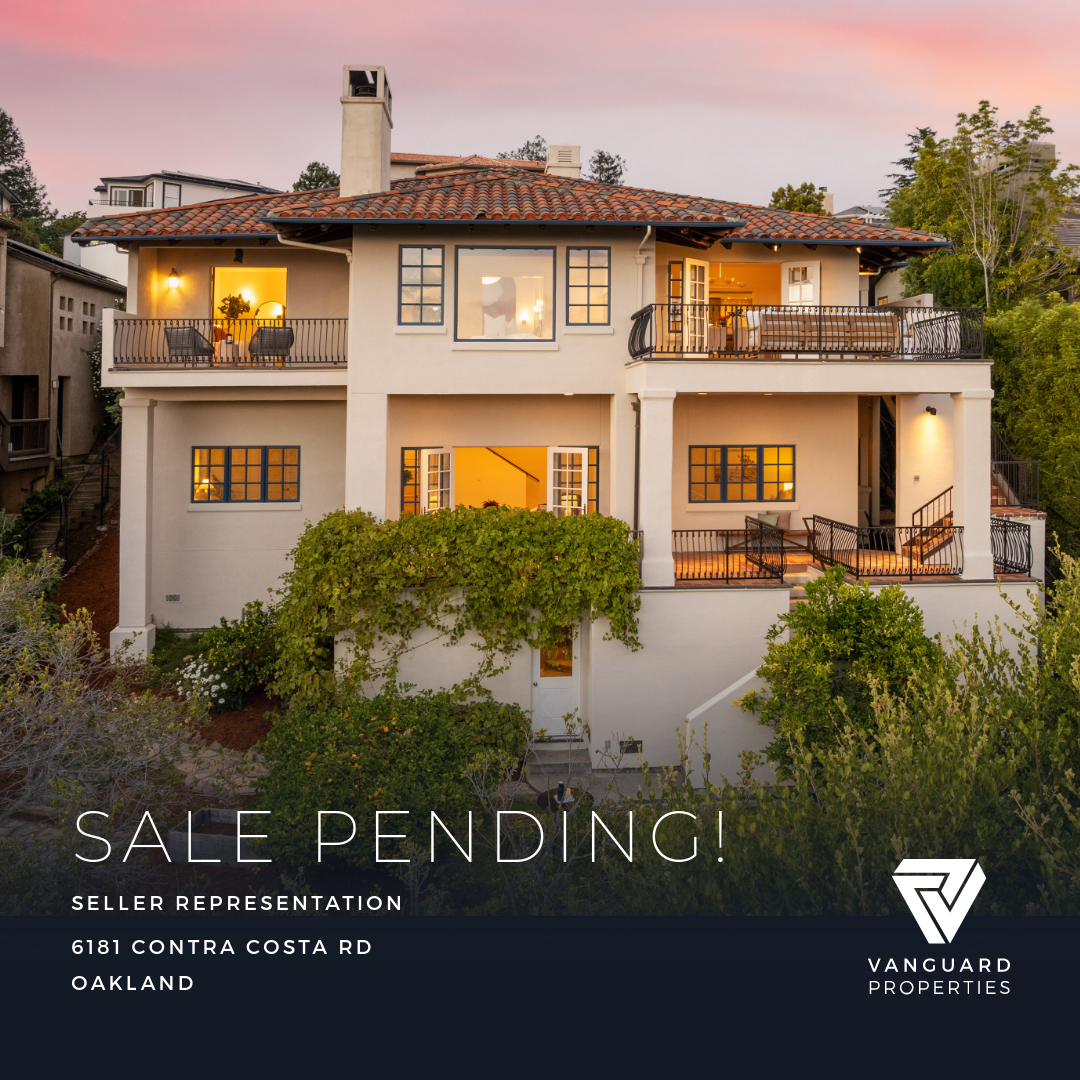
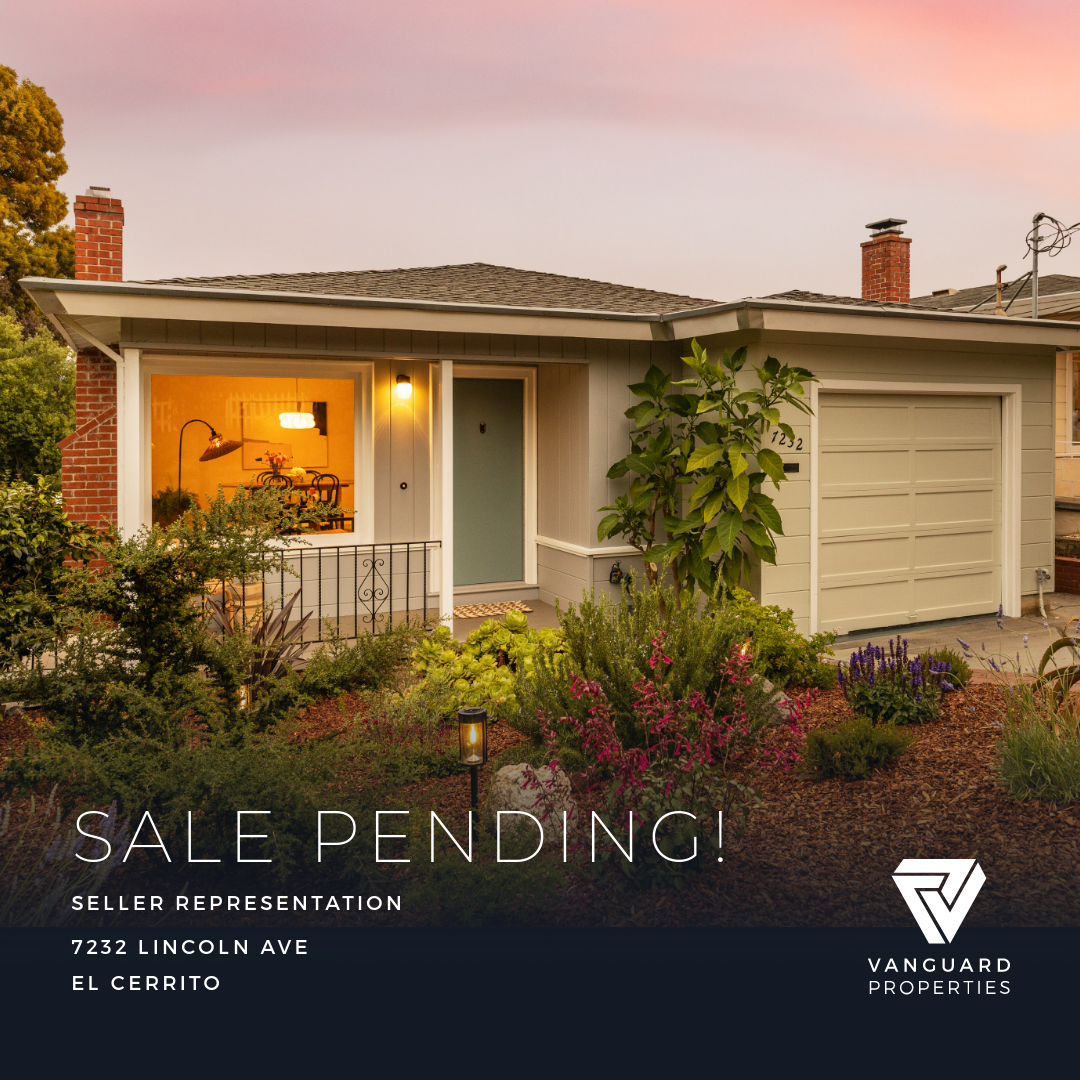
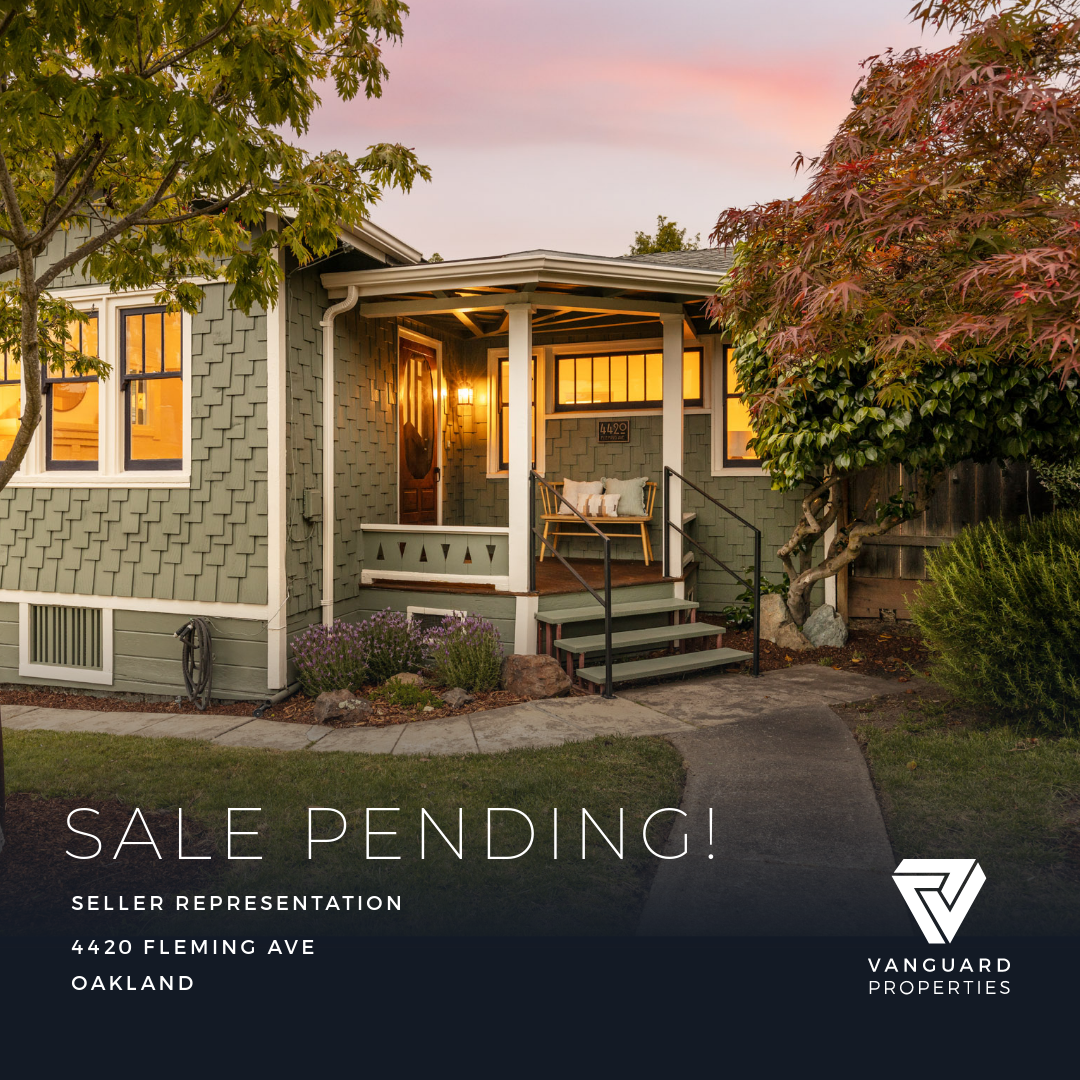
OUR PENDING LISTINGS
Q2 2026 WRAP-UP
The Inner East Bay closed Q2 2026 with one of the strongest setups we have seen in recent quarters: less inventory, more closed sales, more homes going into contract, and stronger competition from buyers. The headline is not just that prices improved. It is that demand expanded while available supply tightened, which is typically the foundation of a much healthier market.
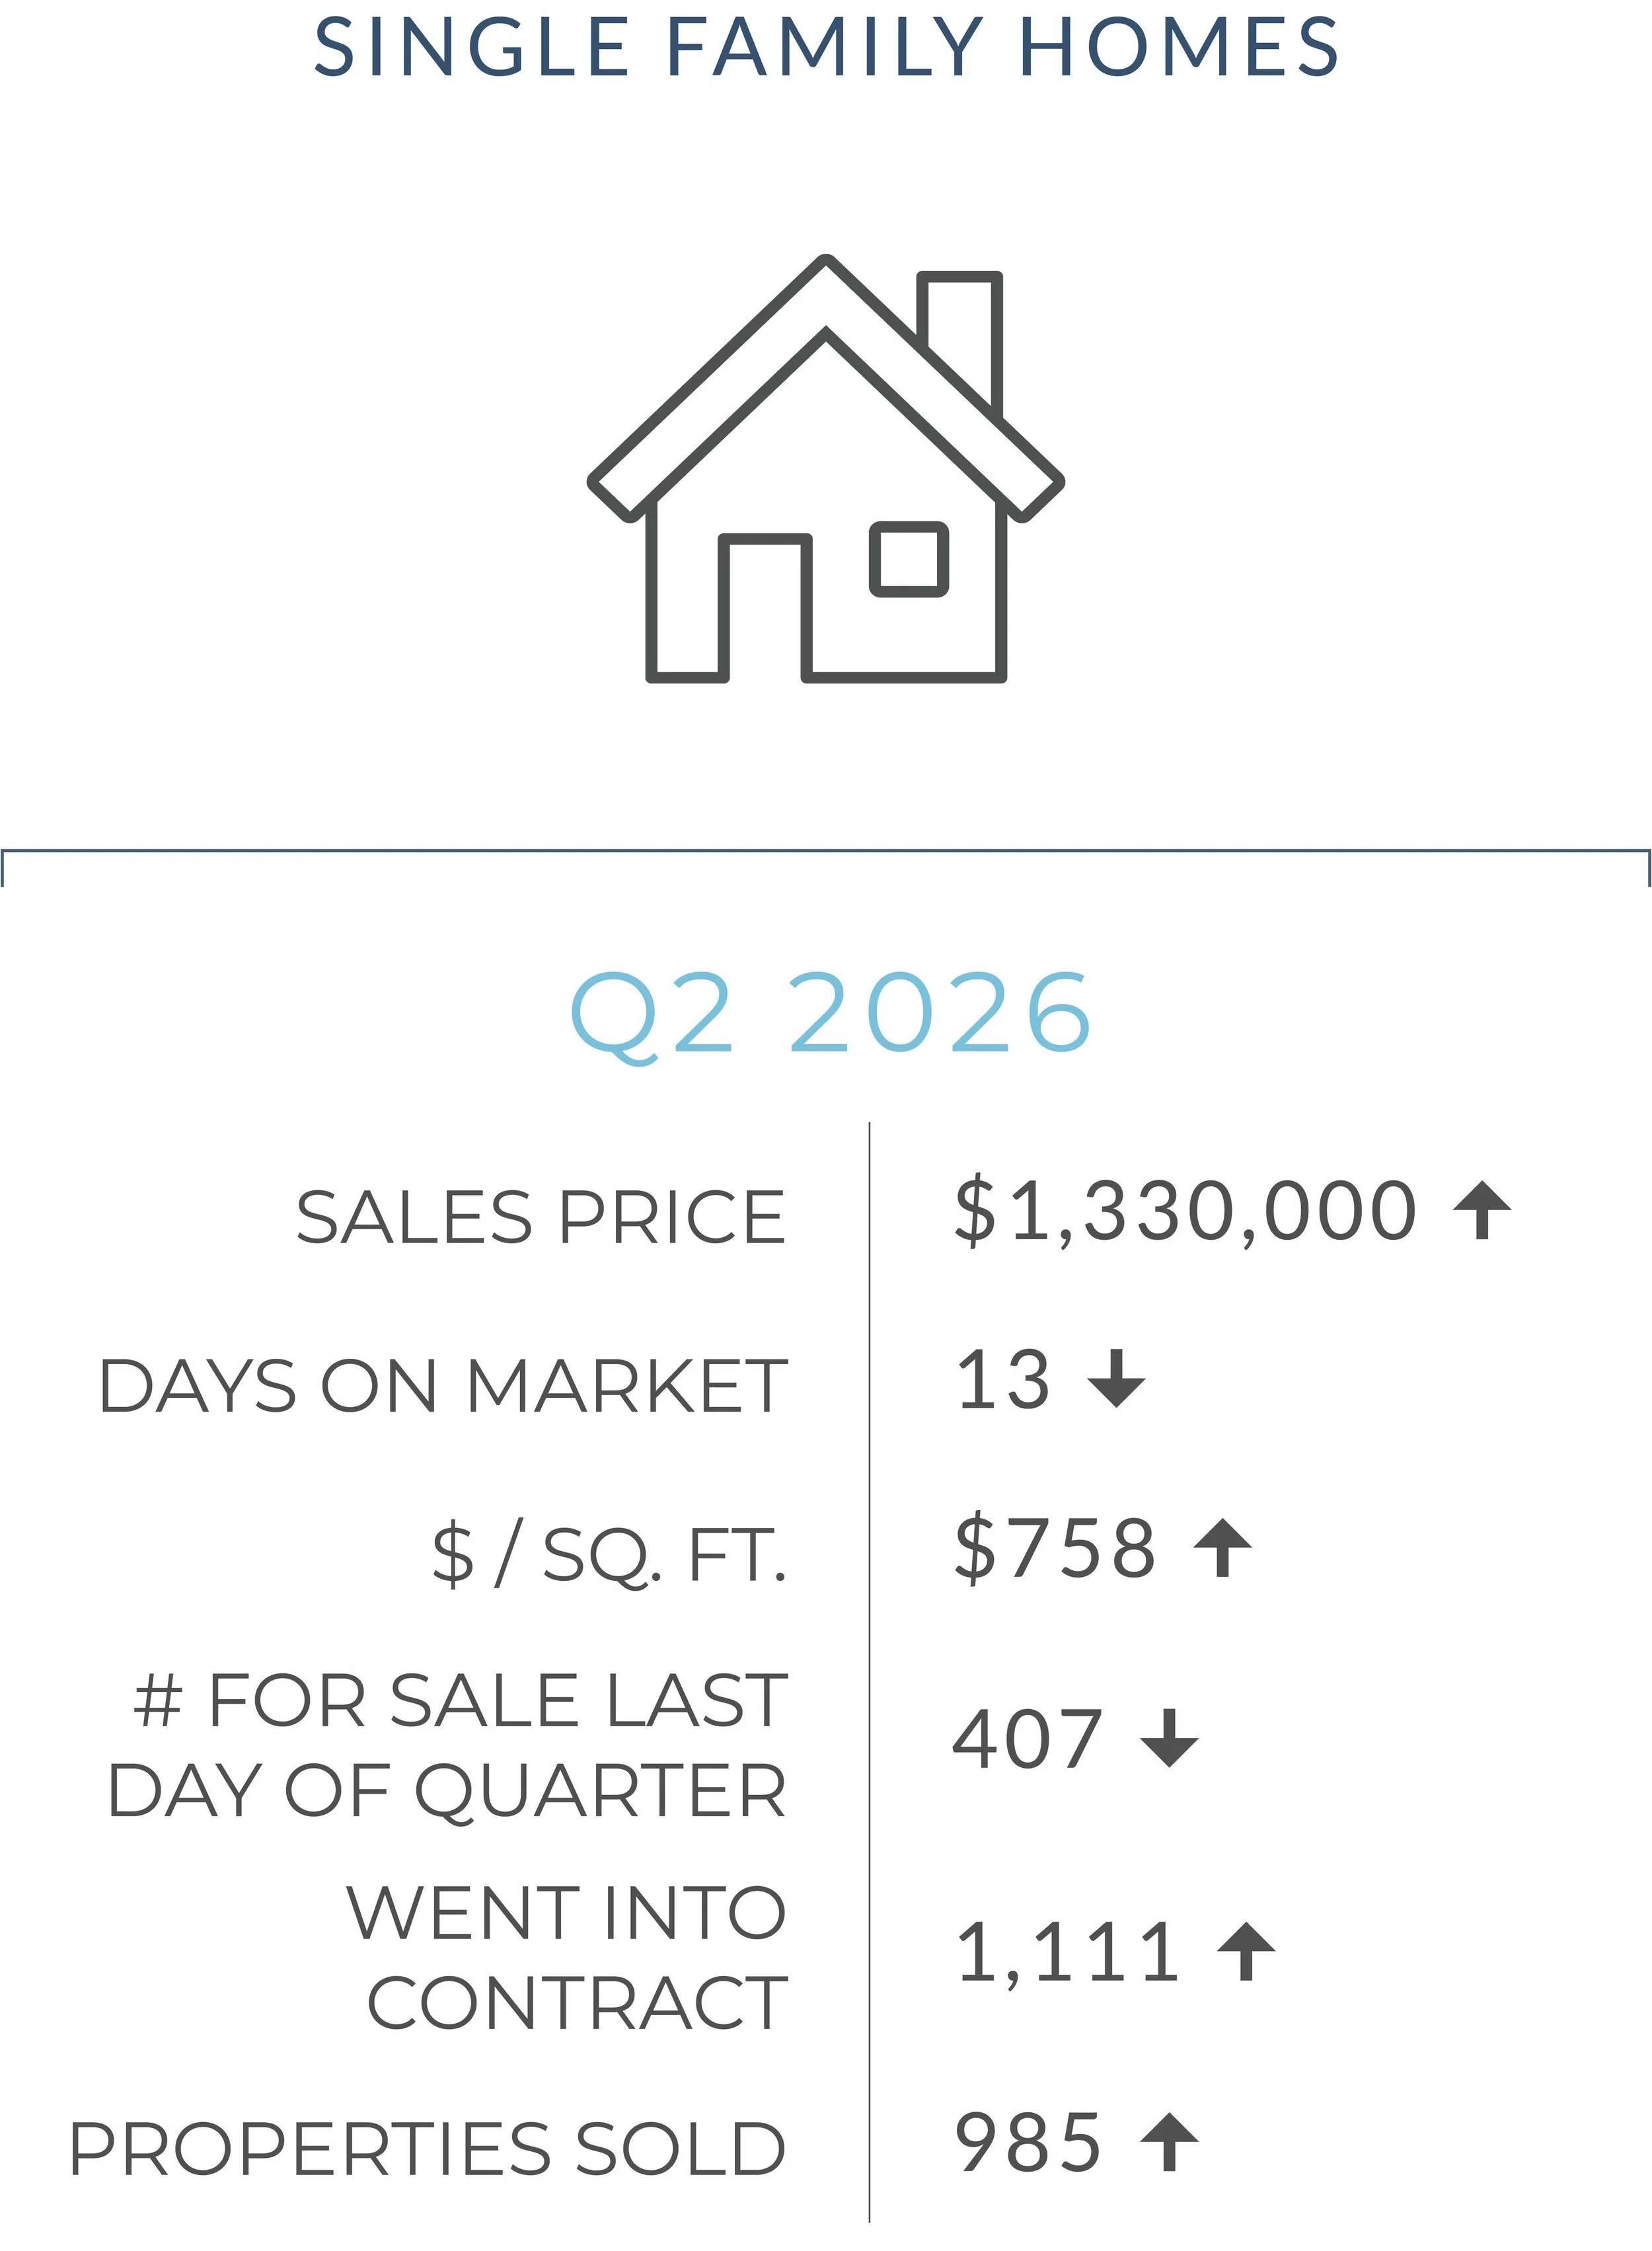
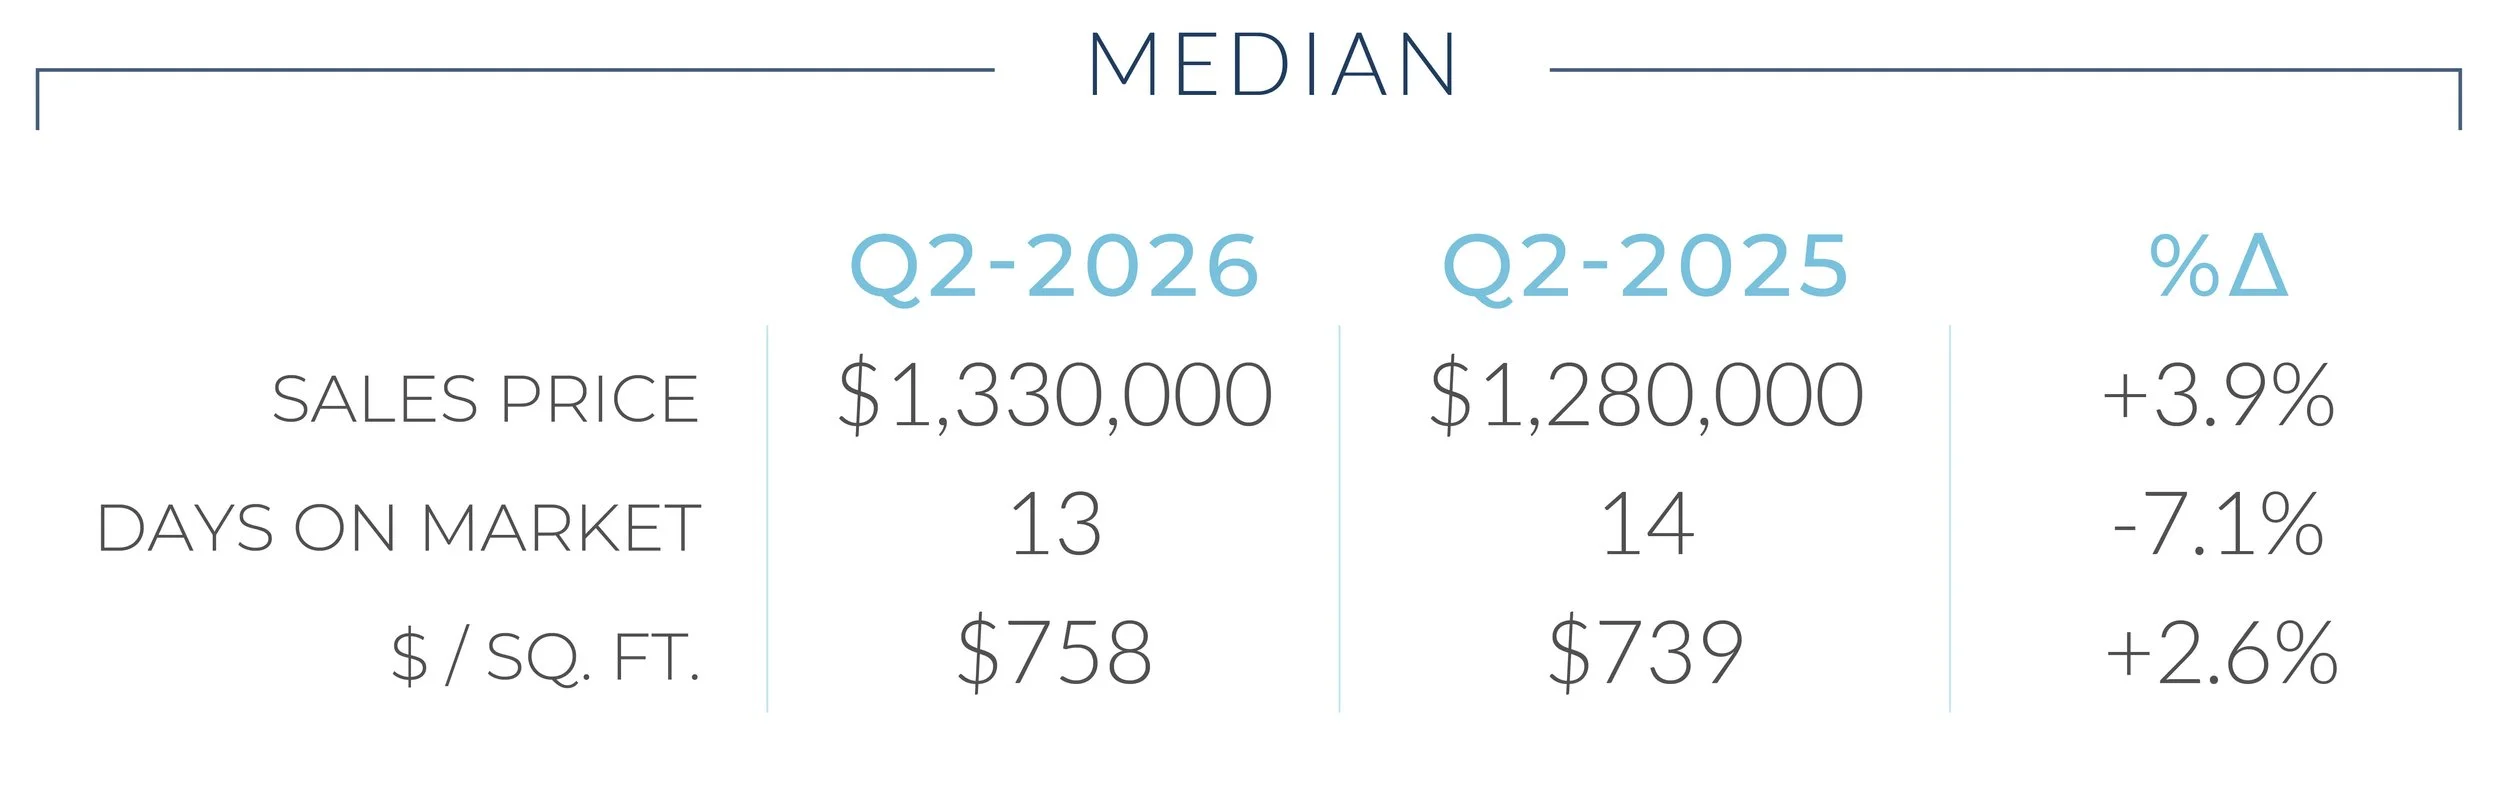
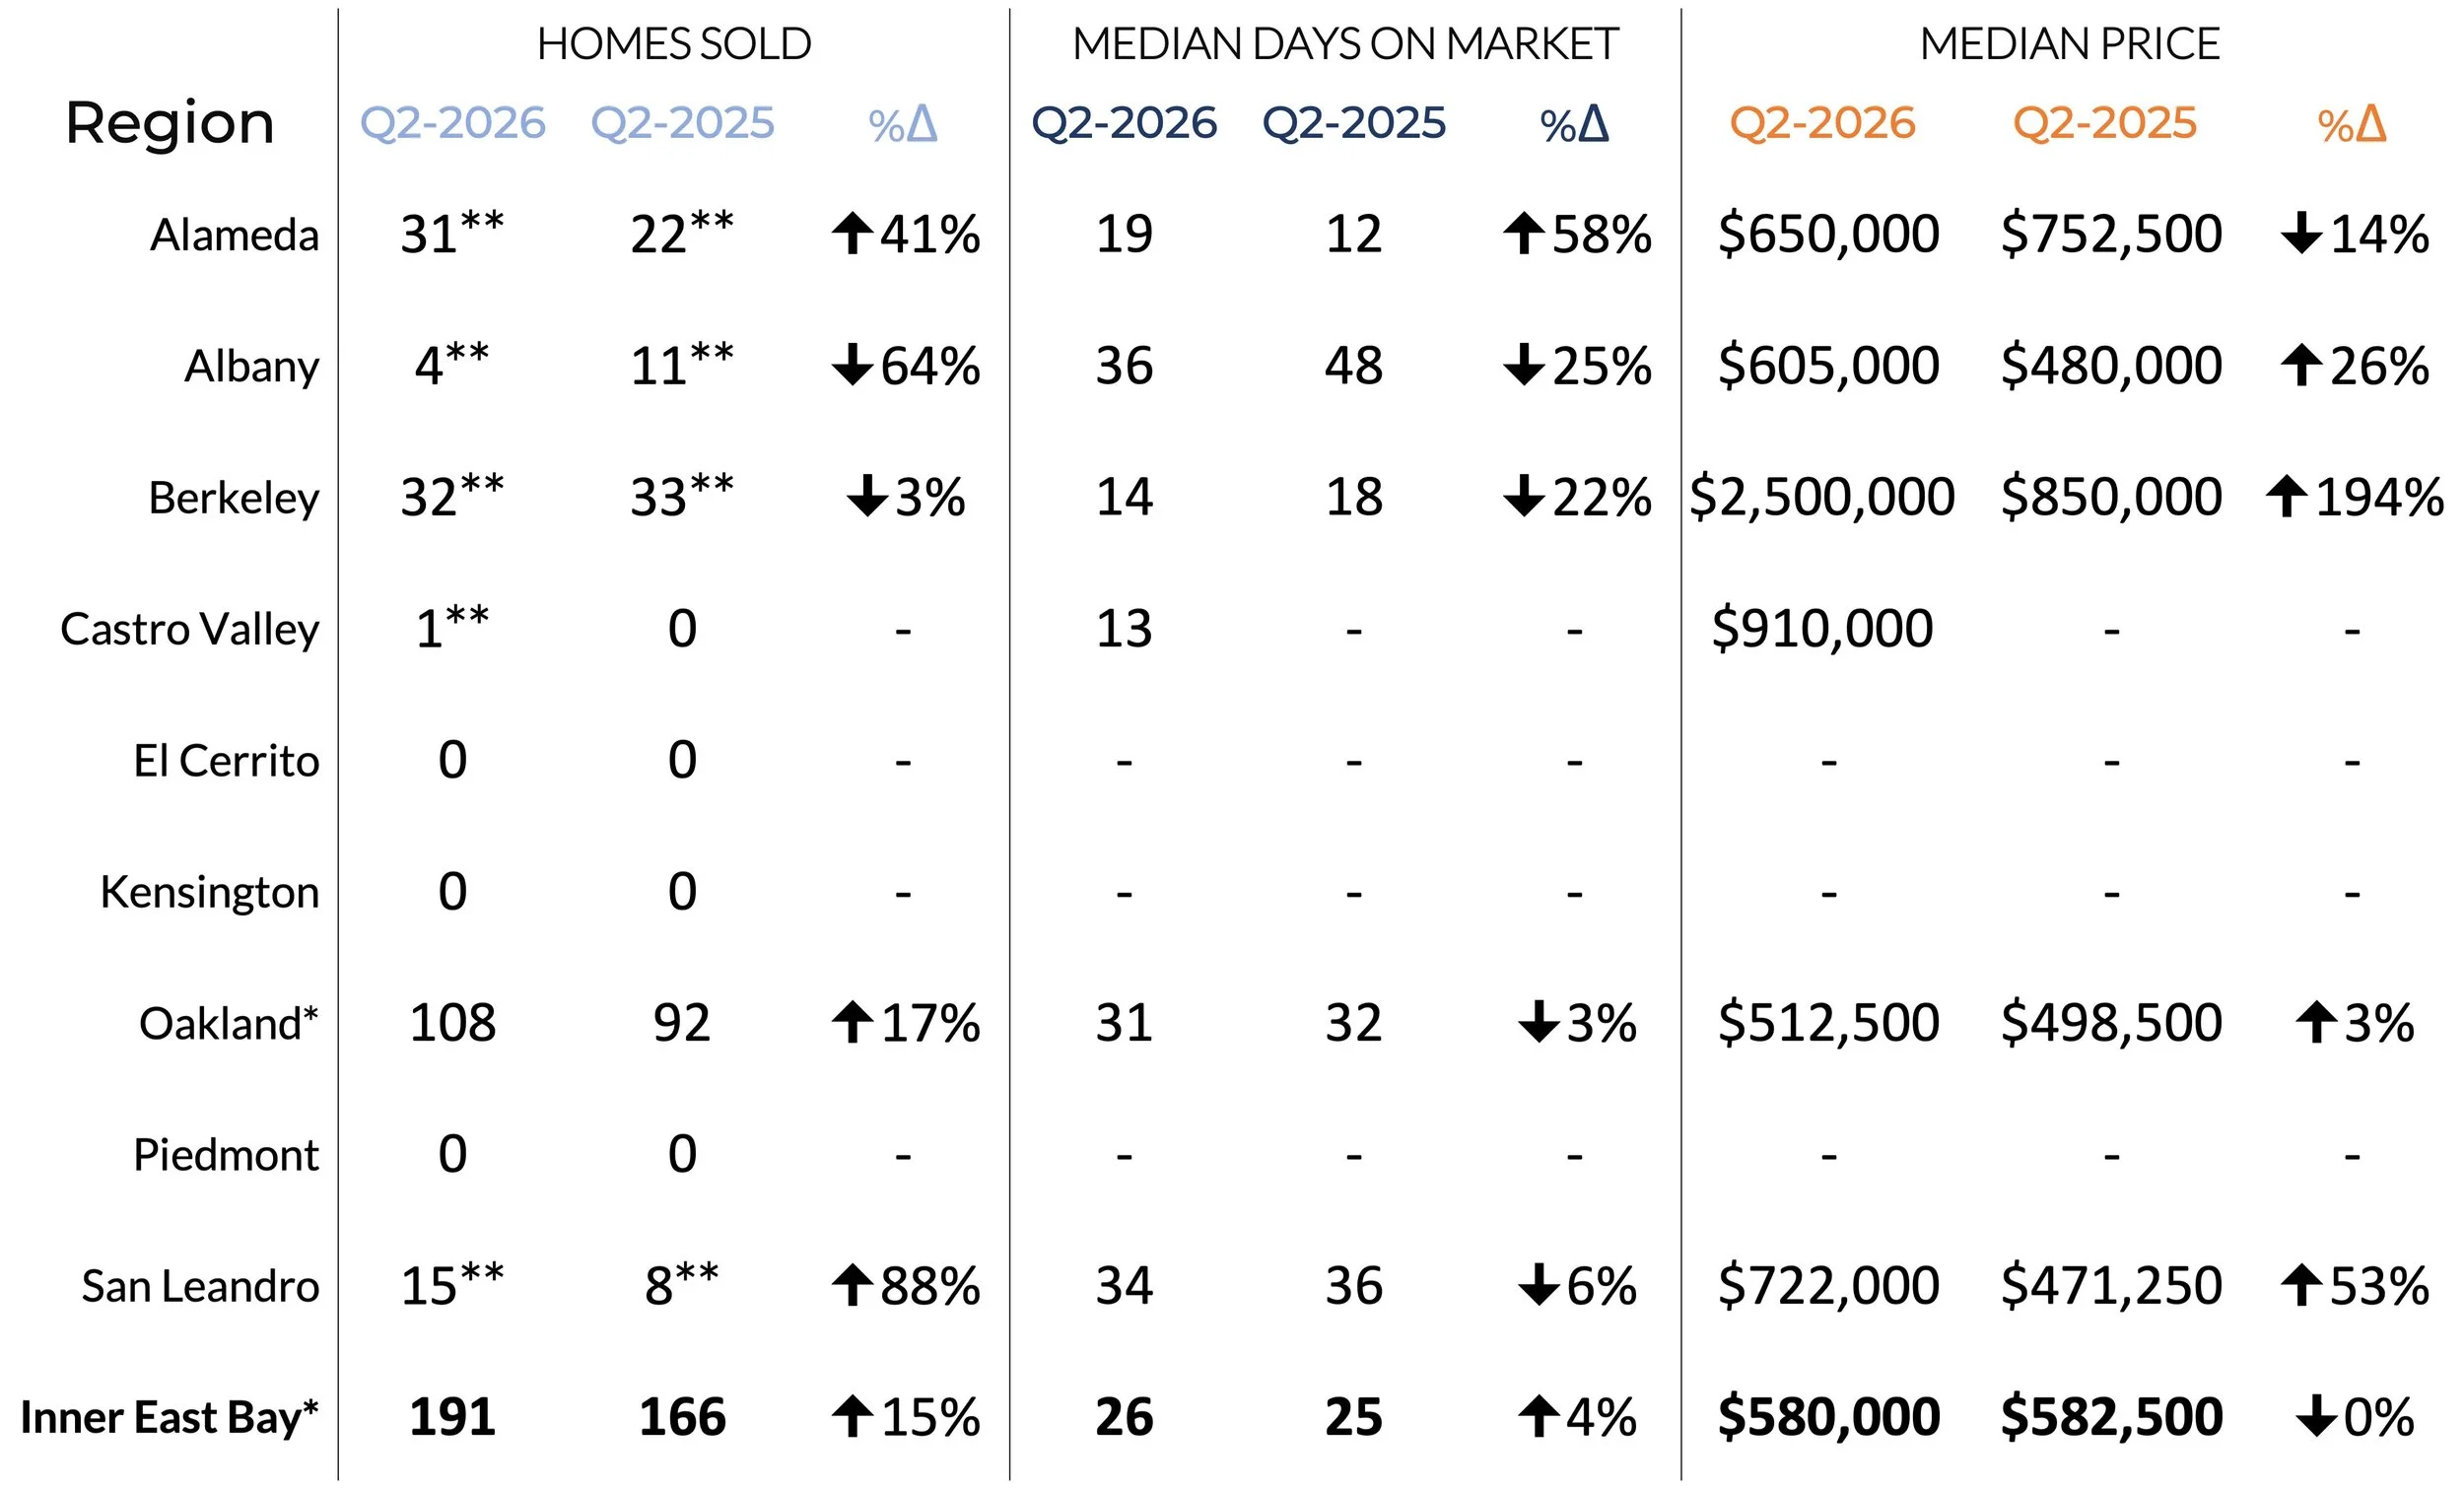
Single-family homes led the way. Active supply at quarter-end was 34.7% lower than last year, yet the number of homes sold still increased 3.1% and homes going into contract rose 4.7%. That imbalance translated directly into stronger seller leverage: 82.7% of single-family homes sold over asking, up from 77.7% last year, and sellers received an average of 121.5% of list price, up from 114.9%. Median pricing also moved higher, with the median sale price rising 3.9% to $1,330,000 and price per square foot increasing 2.6% to $758. Homes moved quickly, with median days on market falling to just 13 days, underscoring how fast well-positioned listings are still being absorbed.
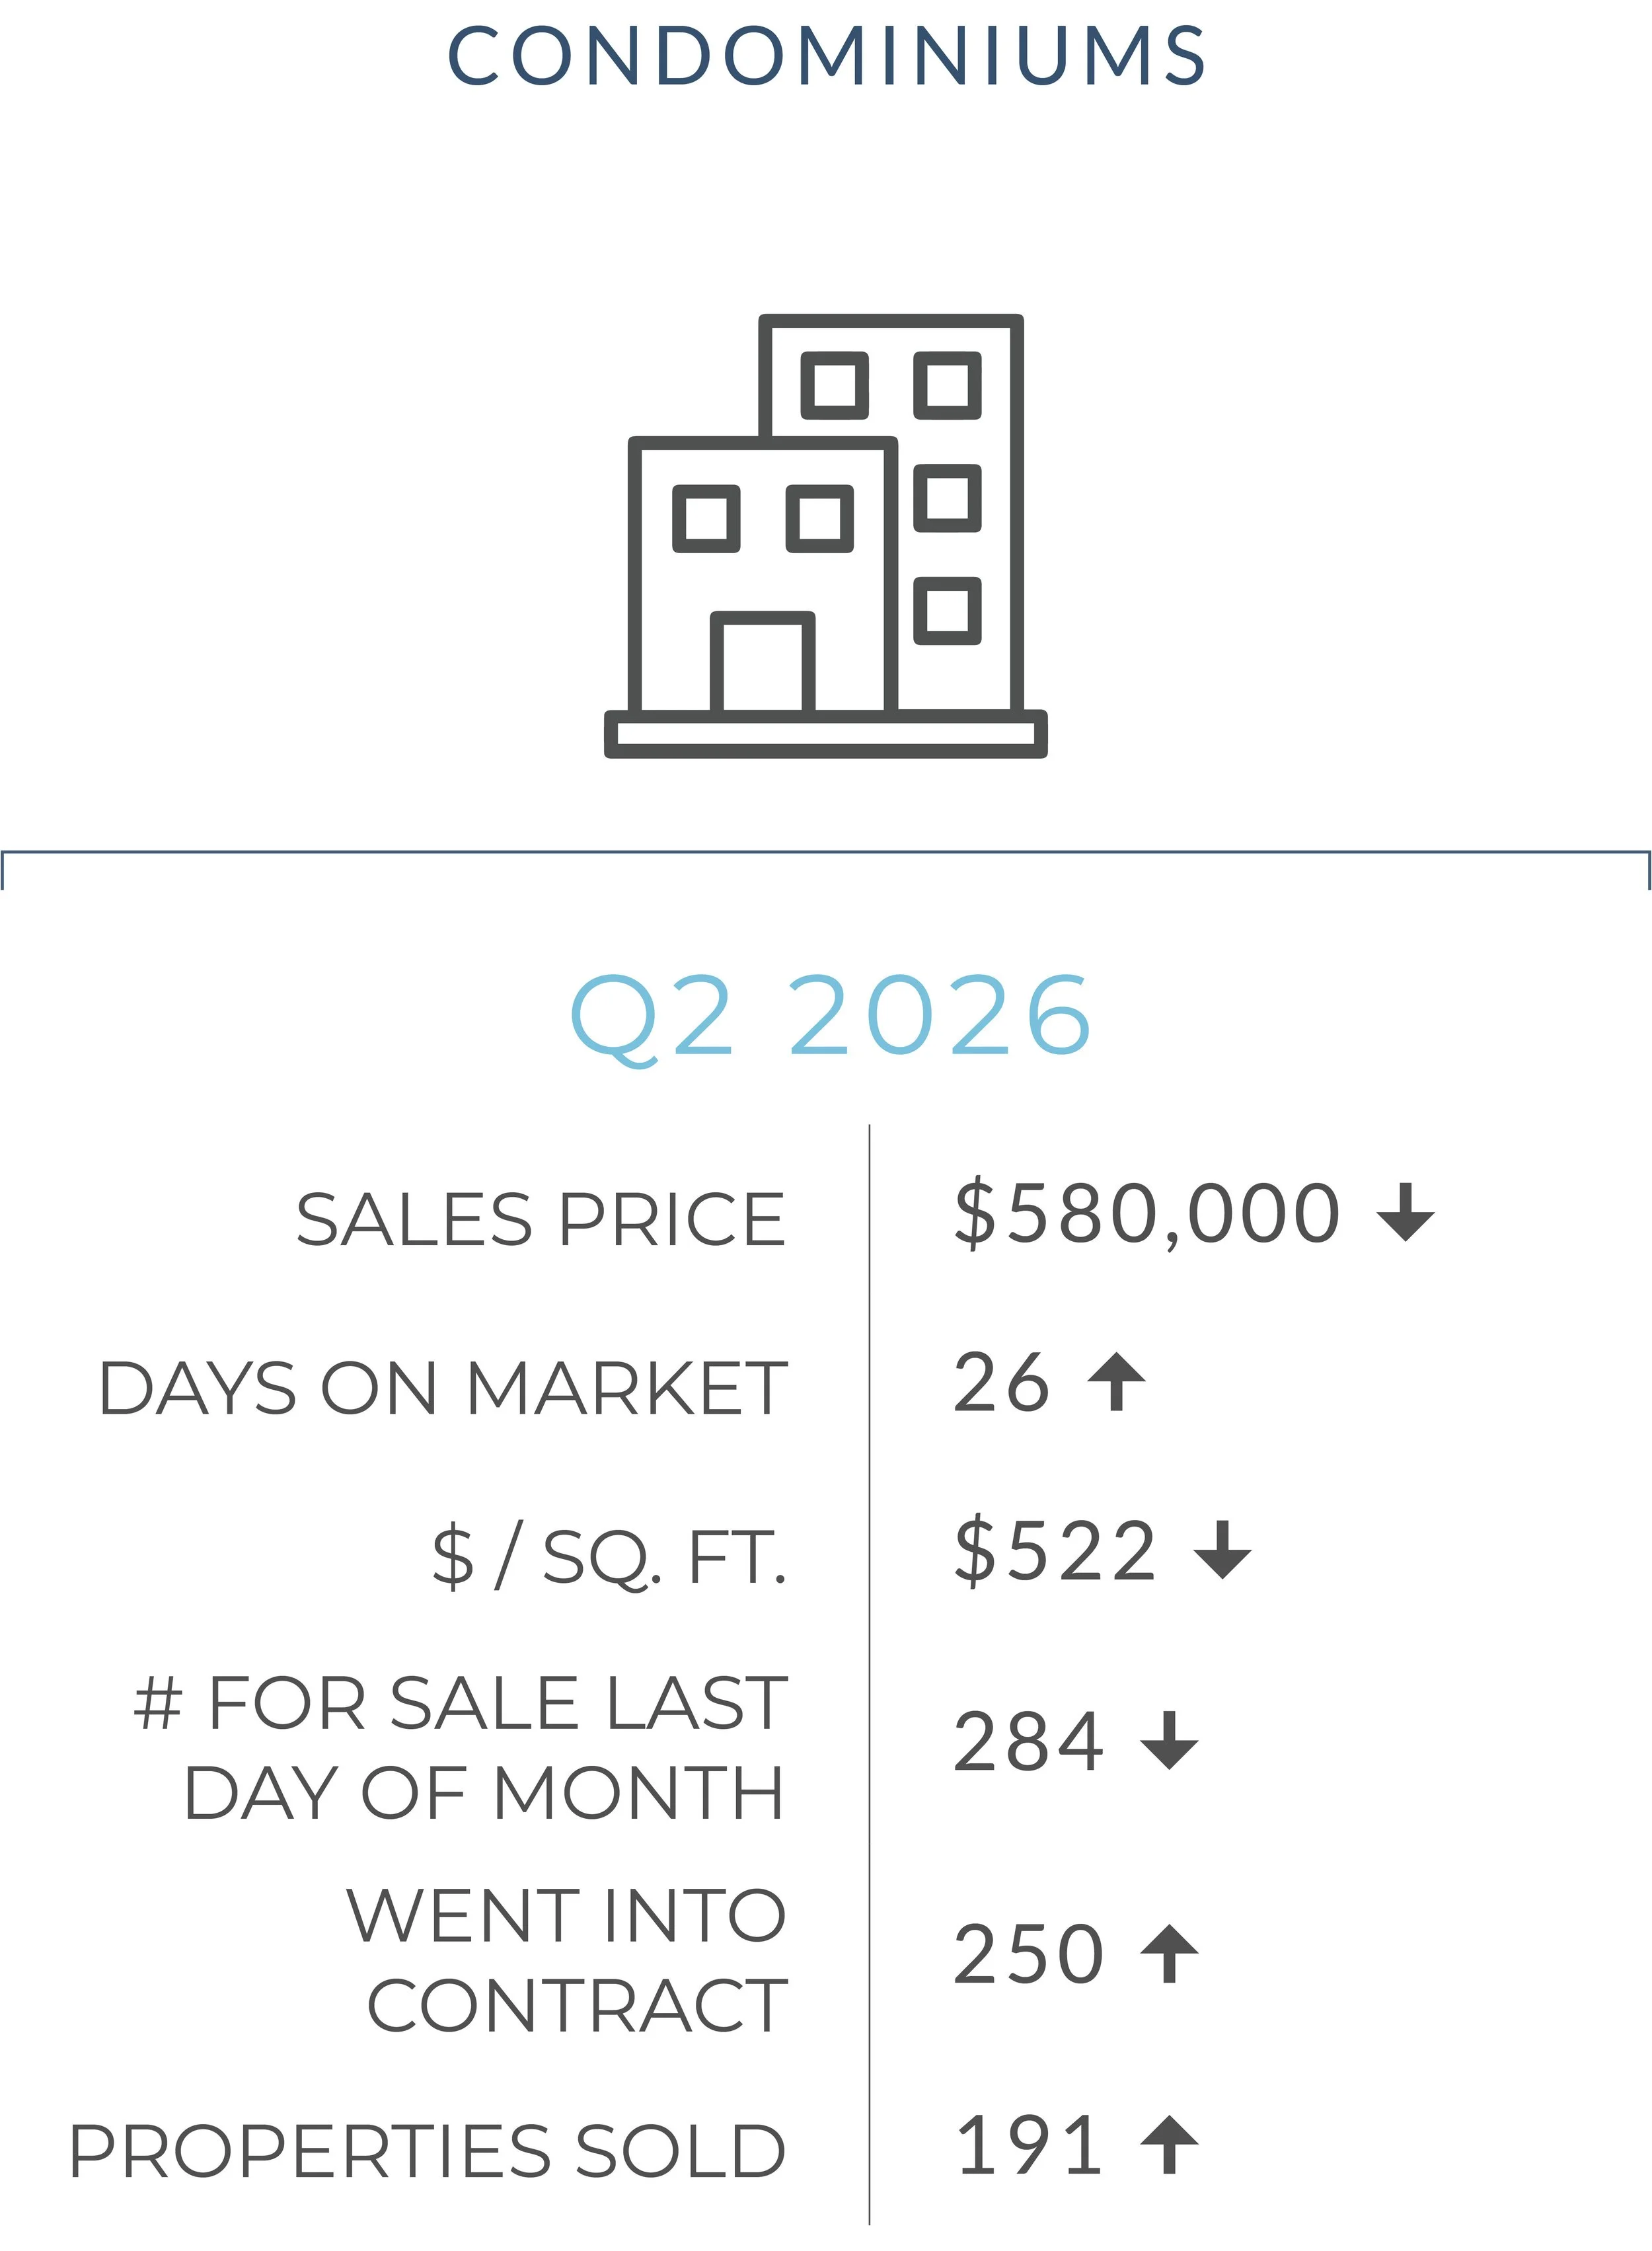
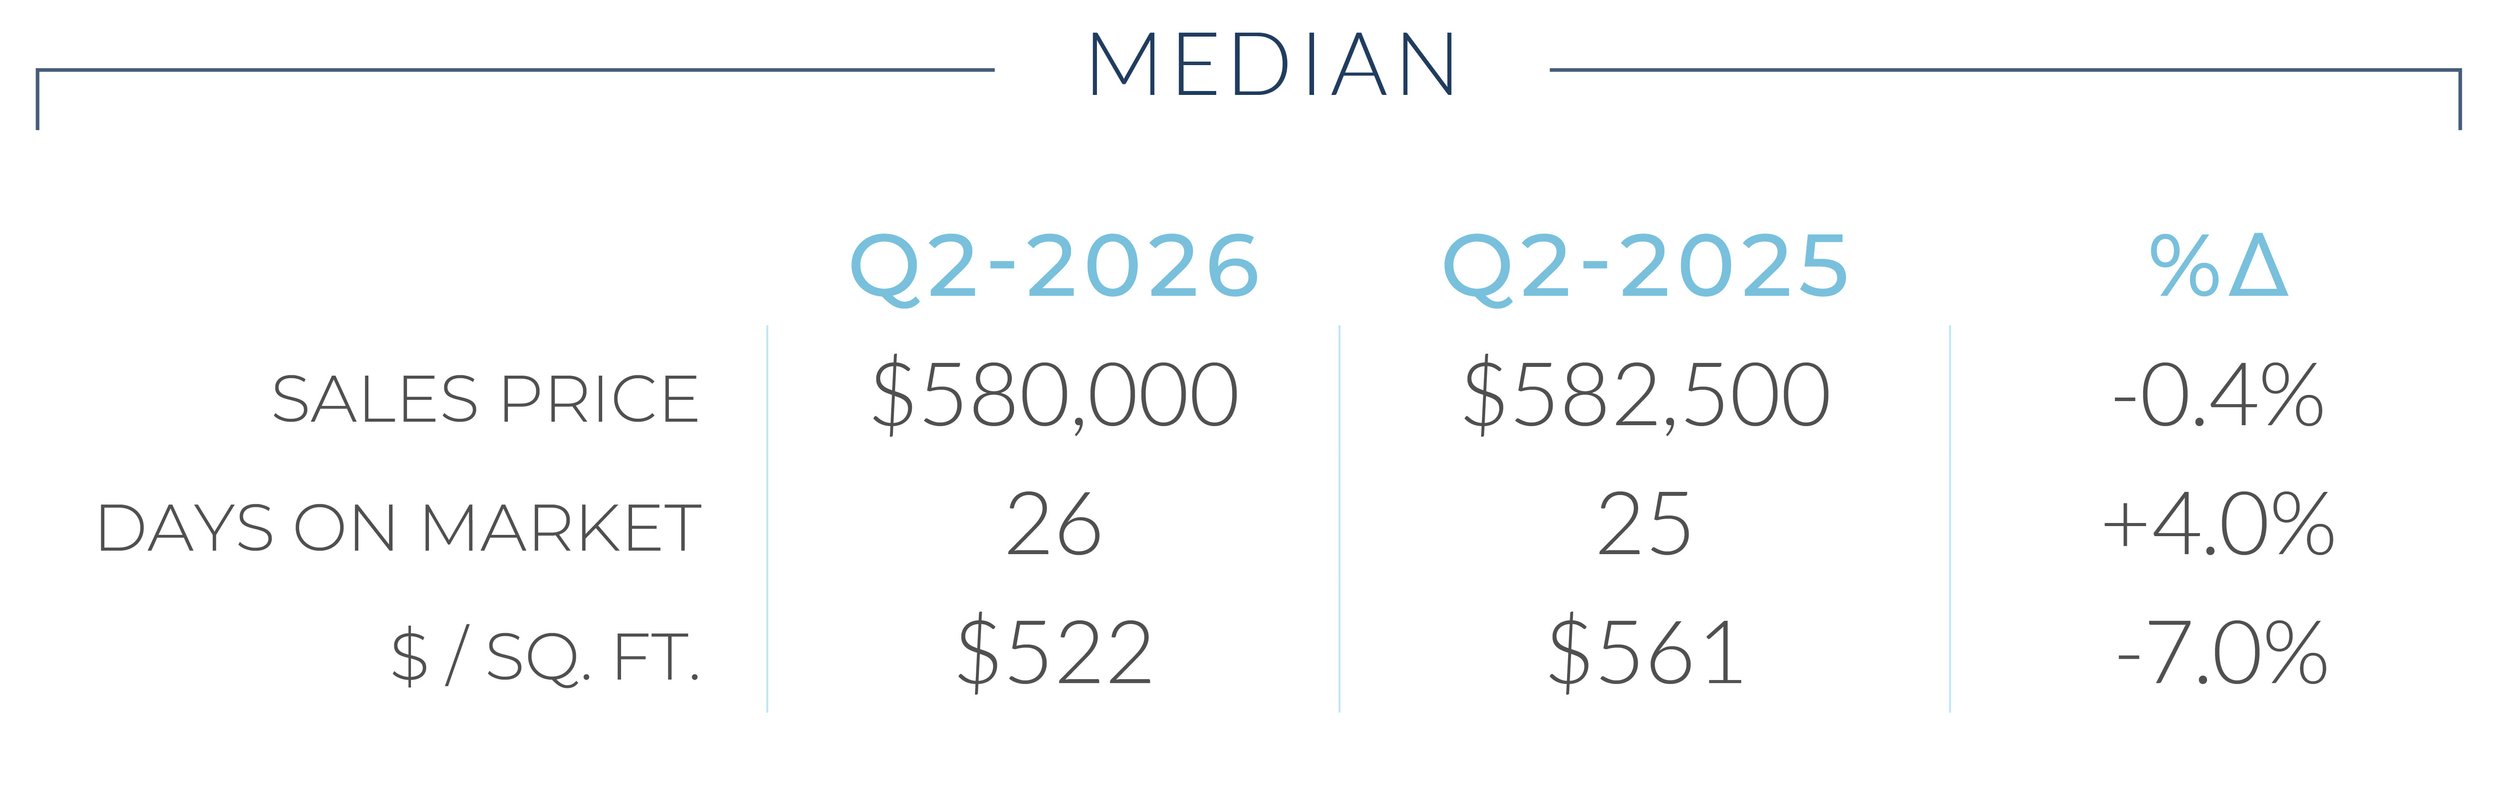
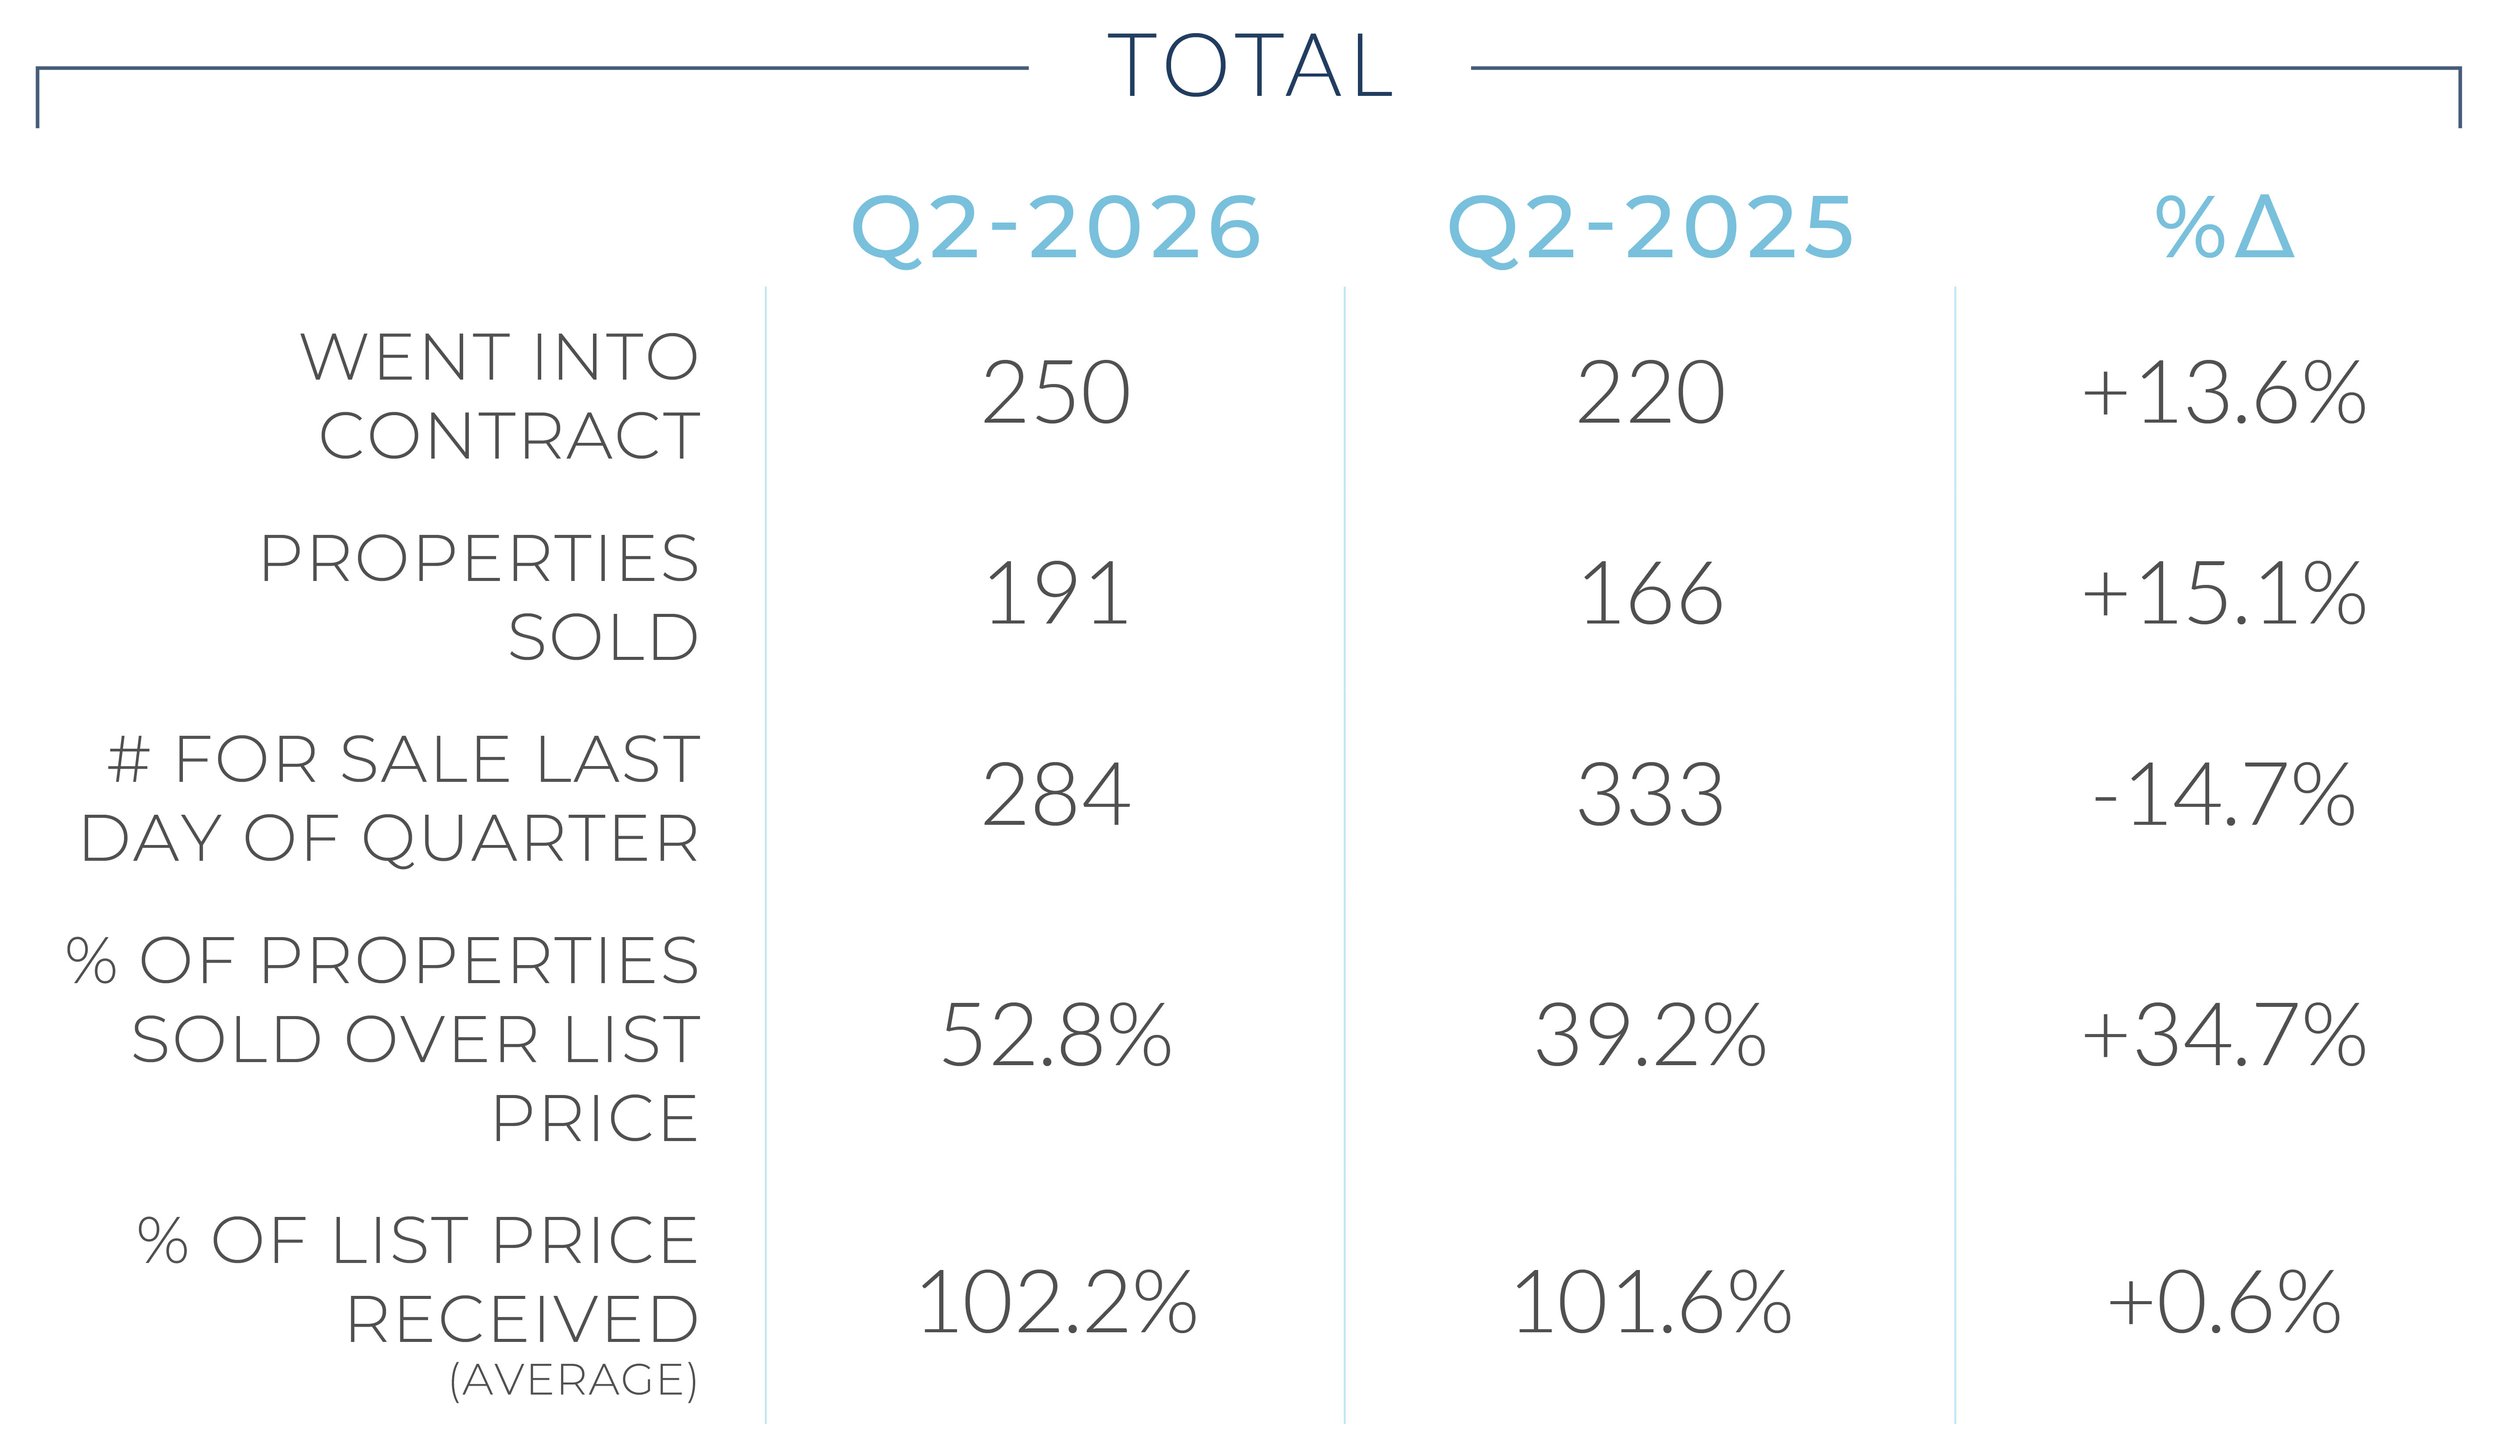
The condominium market also showed meaningful improvement. While the median price was essentially flat, down just 0.4% to $580,000, buyer activity strengthened. Condo sales rose 15.1%, properties going into contract increased 13.6%, and inventory fell 14.7%. Most notably, the share of condos selling over list jumped to 52.8%, up from 39.2% last year, signaling renewed competition in a segment that had been more uneven.
The broader backdrop is also supportive. Mortgage rates remain elevated, but Freddie Mac’s July 9 reading showed the average 30-year fixed rate at 6.49%, still below 6.72% a year ago, with Freddie noting that economic growth and affordability have continued to improve for buyers. Local employment remains a stabilizing force as well: the Oakland-Fremont-Berkeley metro division’s unemployment rate declined to 3.9% in May, down from 4.2% in April. California also added 102,900 jobs year over year as of May 2026.
Overall, Q2 points to an Inner East Bay market that is tightening, competitive, and gaining momentum. With inventory constrained, local employment steady, and regional wealth creation improving, the Inner East Bay enters the second half of 2026 from a position of strength.
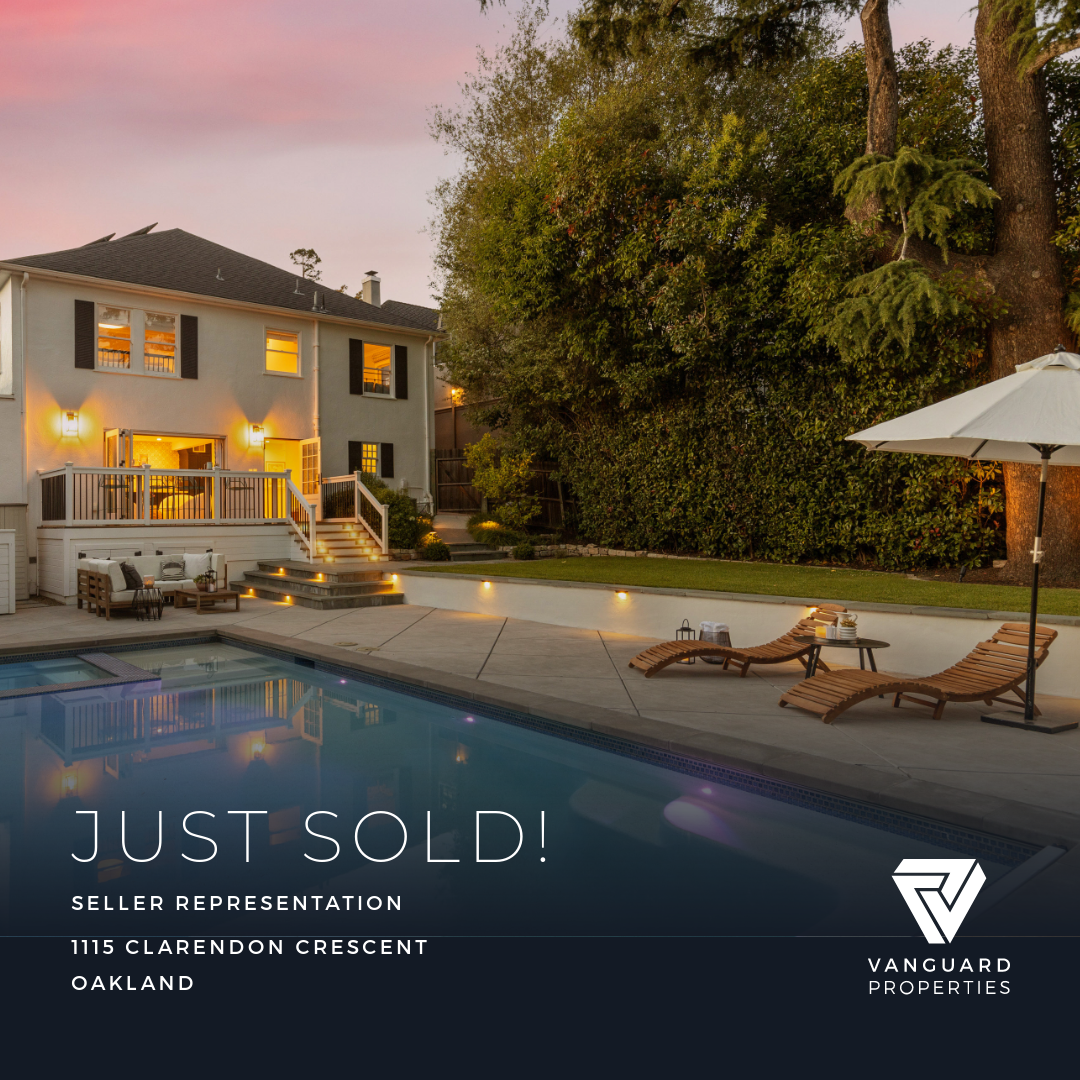
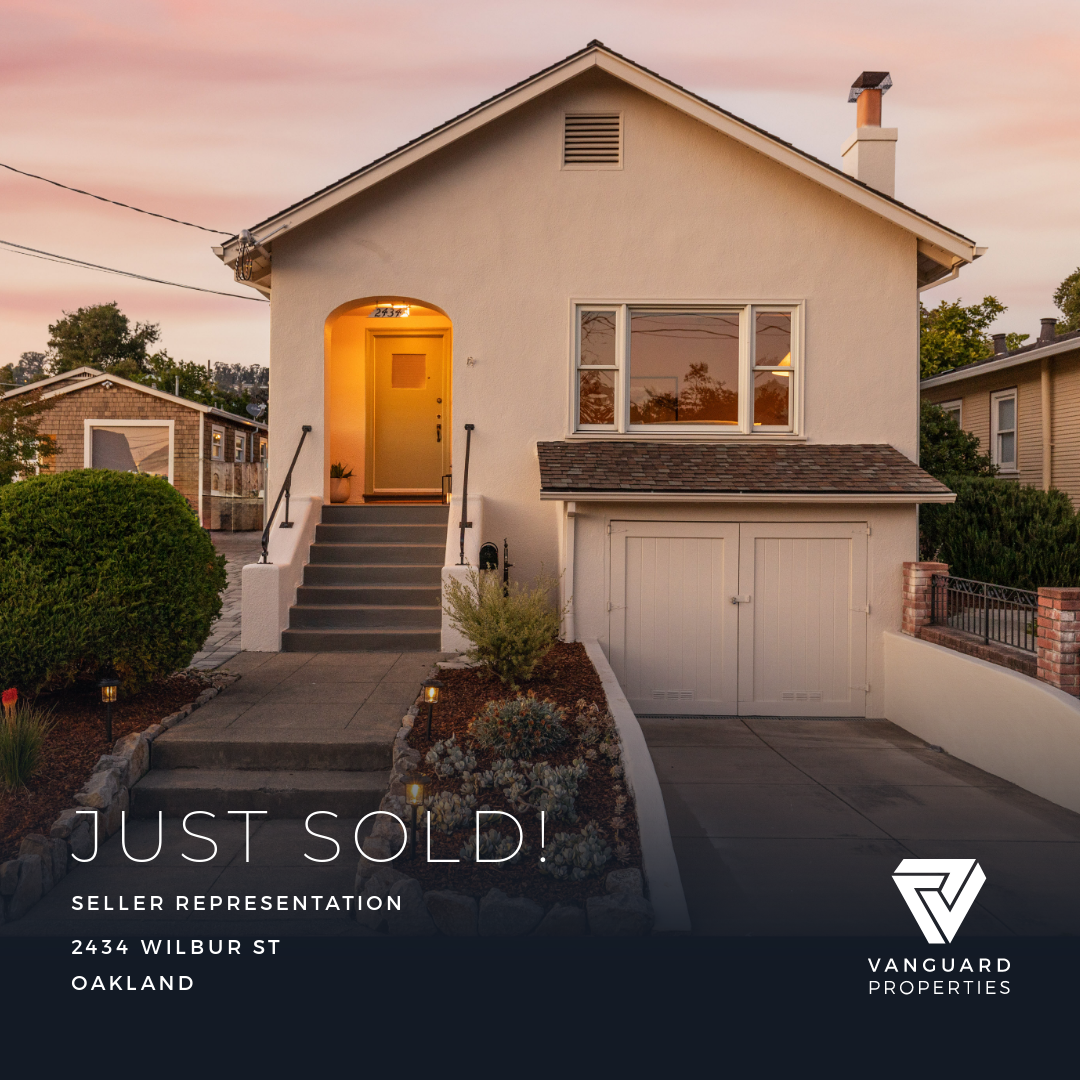
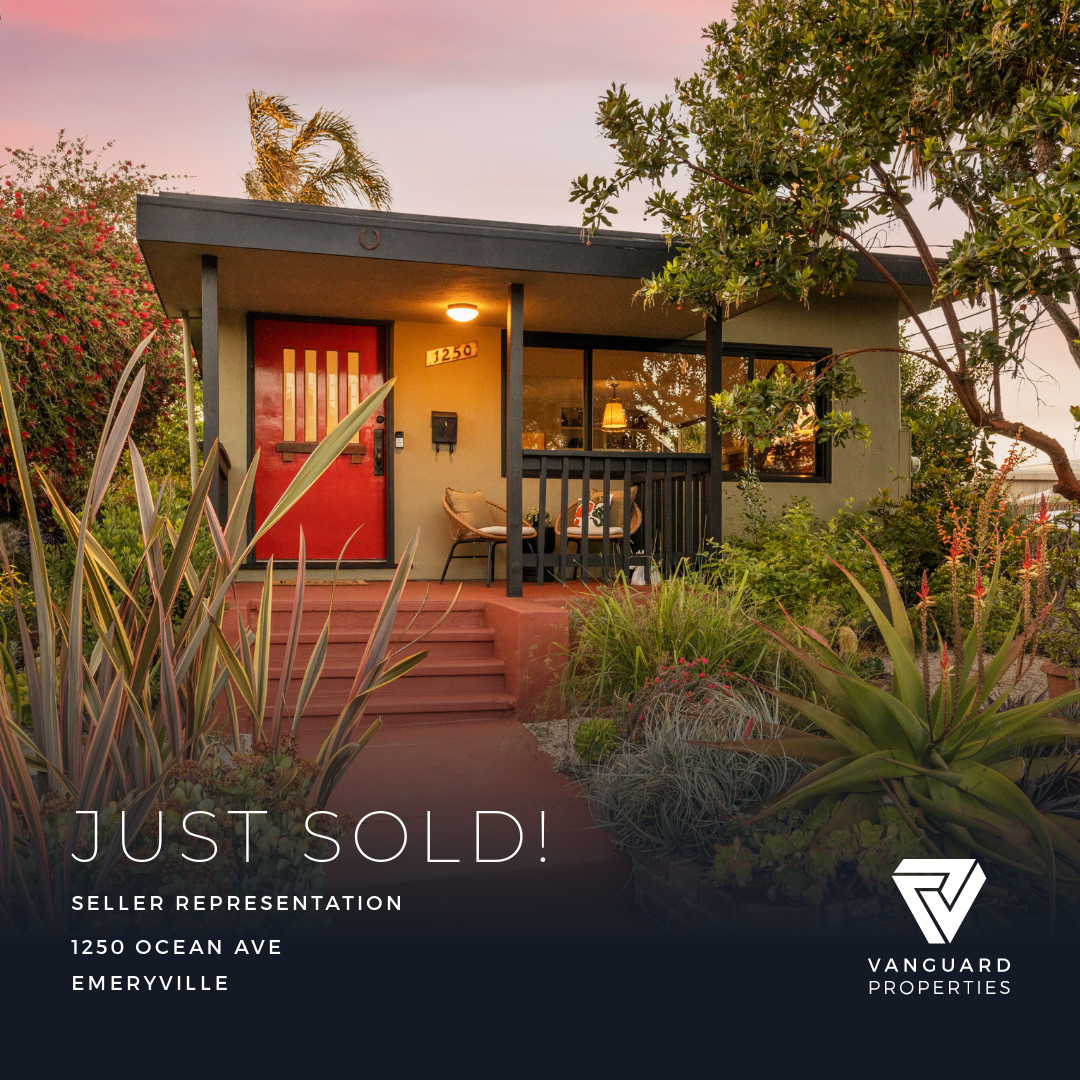
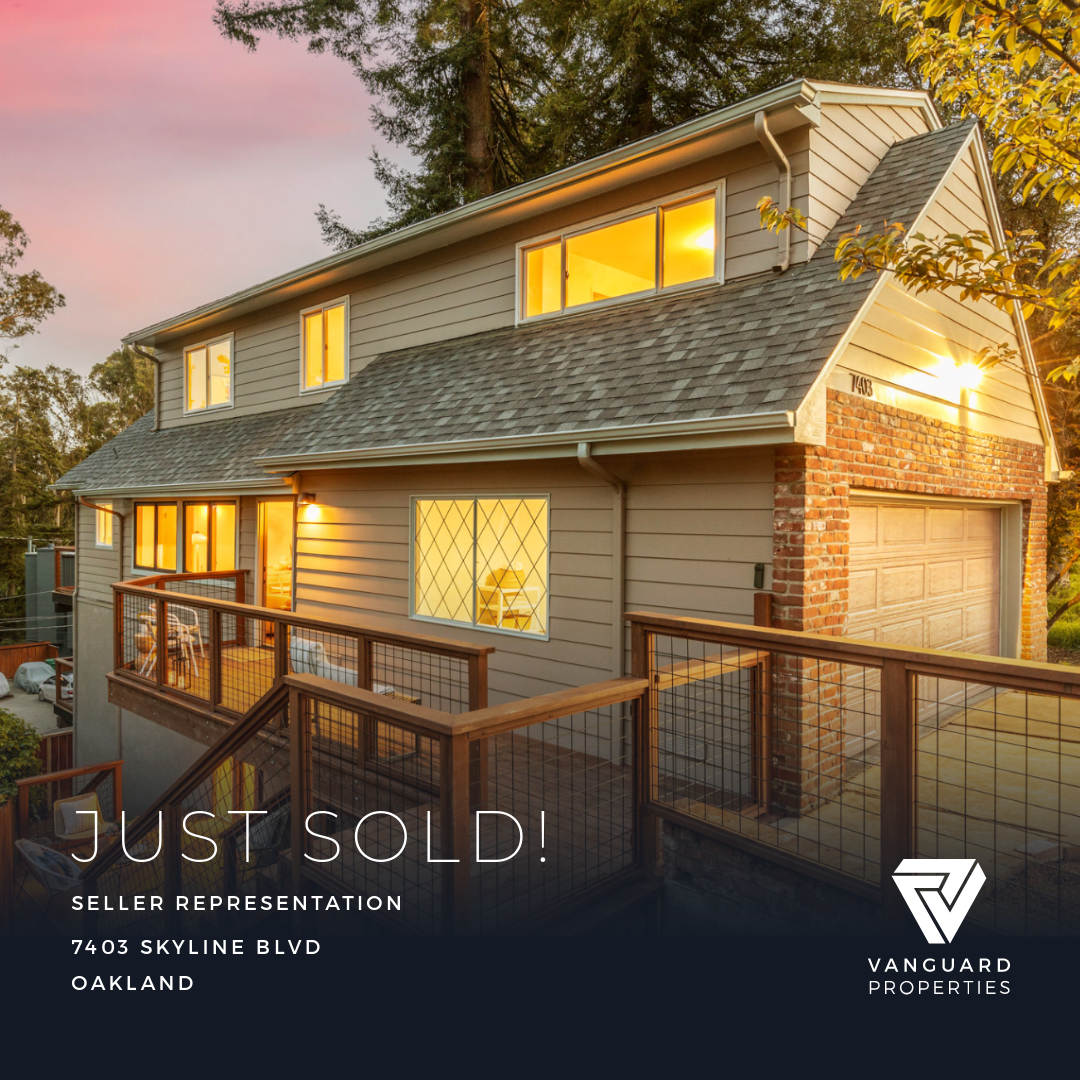
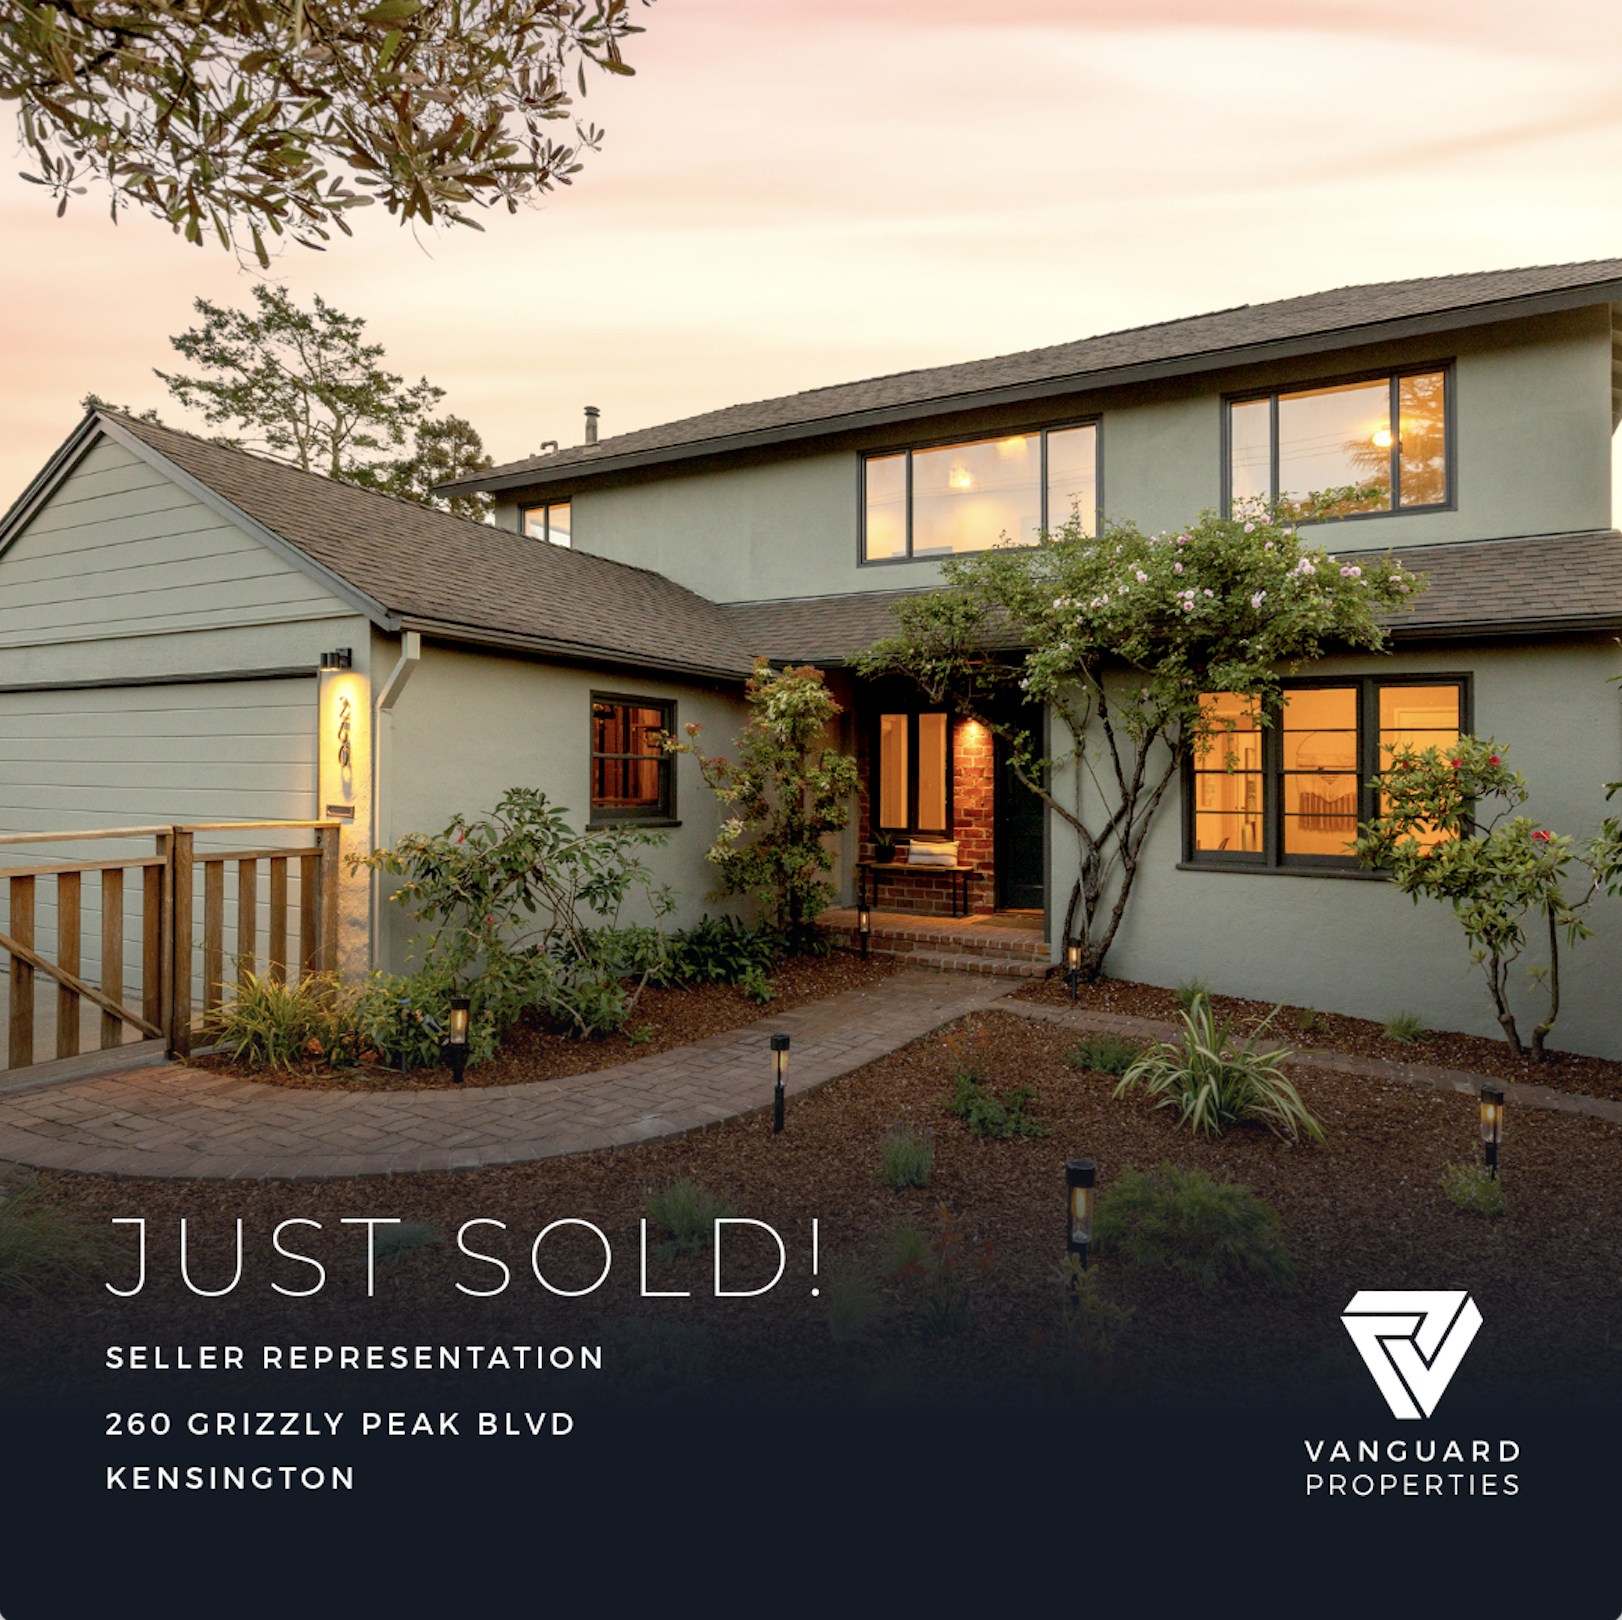
OUR RECENTLY SOLD LISTINGS
MEDIAN AREA VALUES
SINGLE FAMILY RESIDENCES
Q2 2026
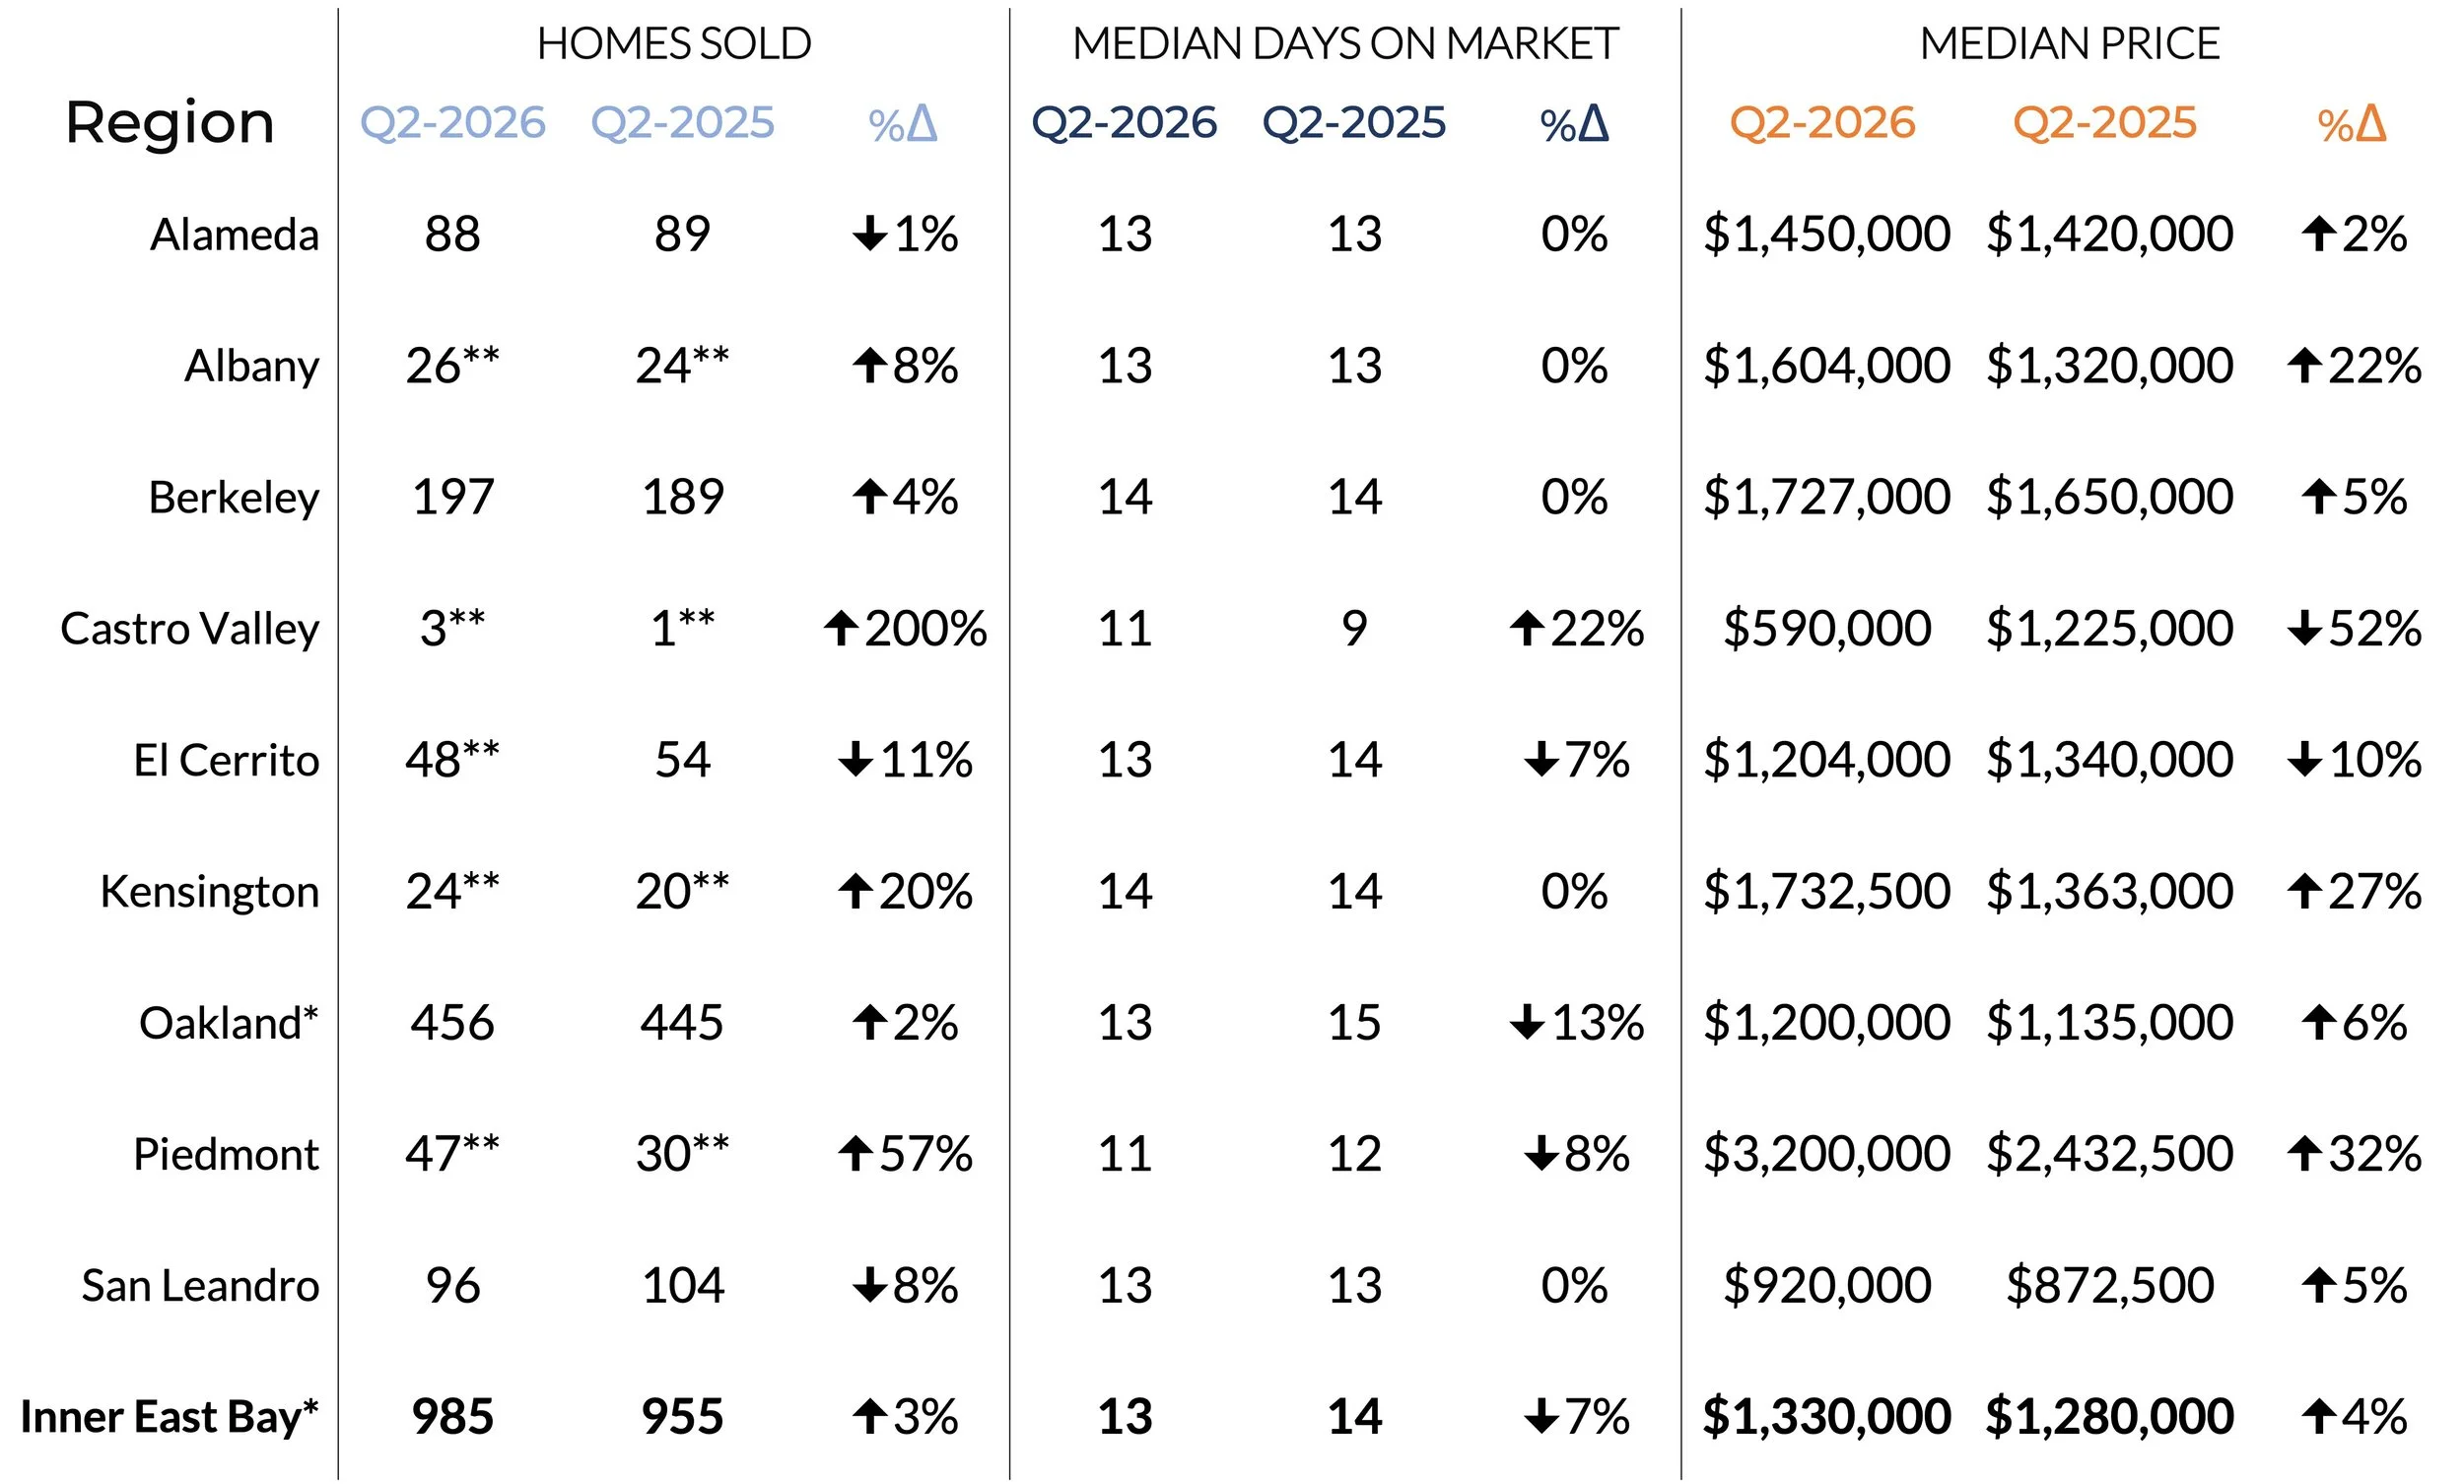
** Denotes small sample size; Use caution when interpreting results.
YEAR-OVER-YEAR COMPARISON
SINGLE FAMILY RESIDENCES
MONTH-OVER-MONTH COMPARISON
SINGLE FAMILY RESIDENCES
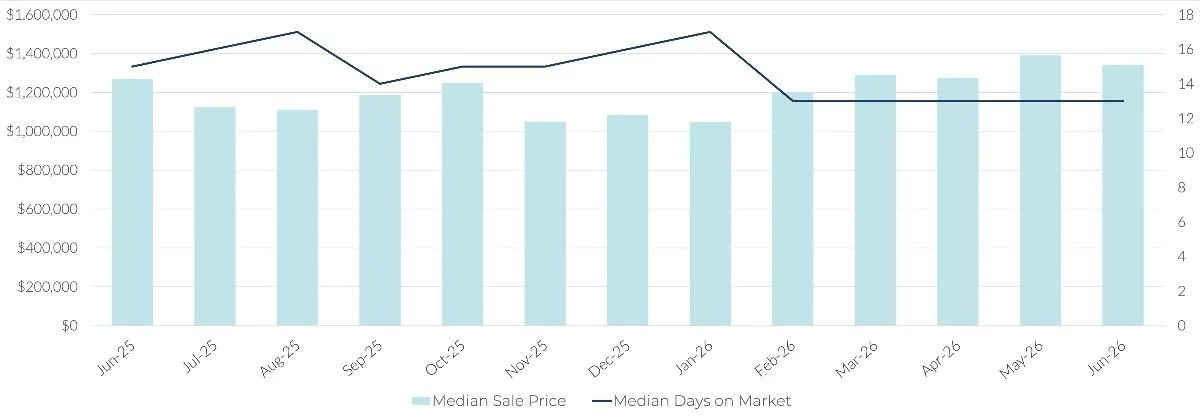
CHANGE IN PAST MONTH:
SALES PRICE
-3.5%
DAYS ON MARKET
No change
YEAR-OVER-YEAR COMPARISON
CONDOMINIUMS
MEDIAN AREA VALUES
CONDOMINIUMS
Q2 2026
YEAR-OVER-YEAR COMPARISON
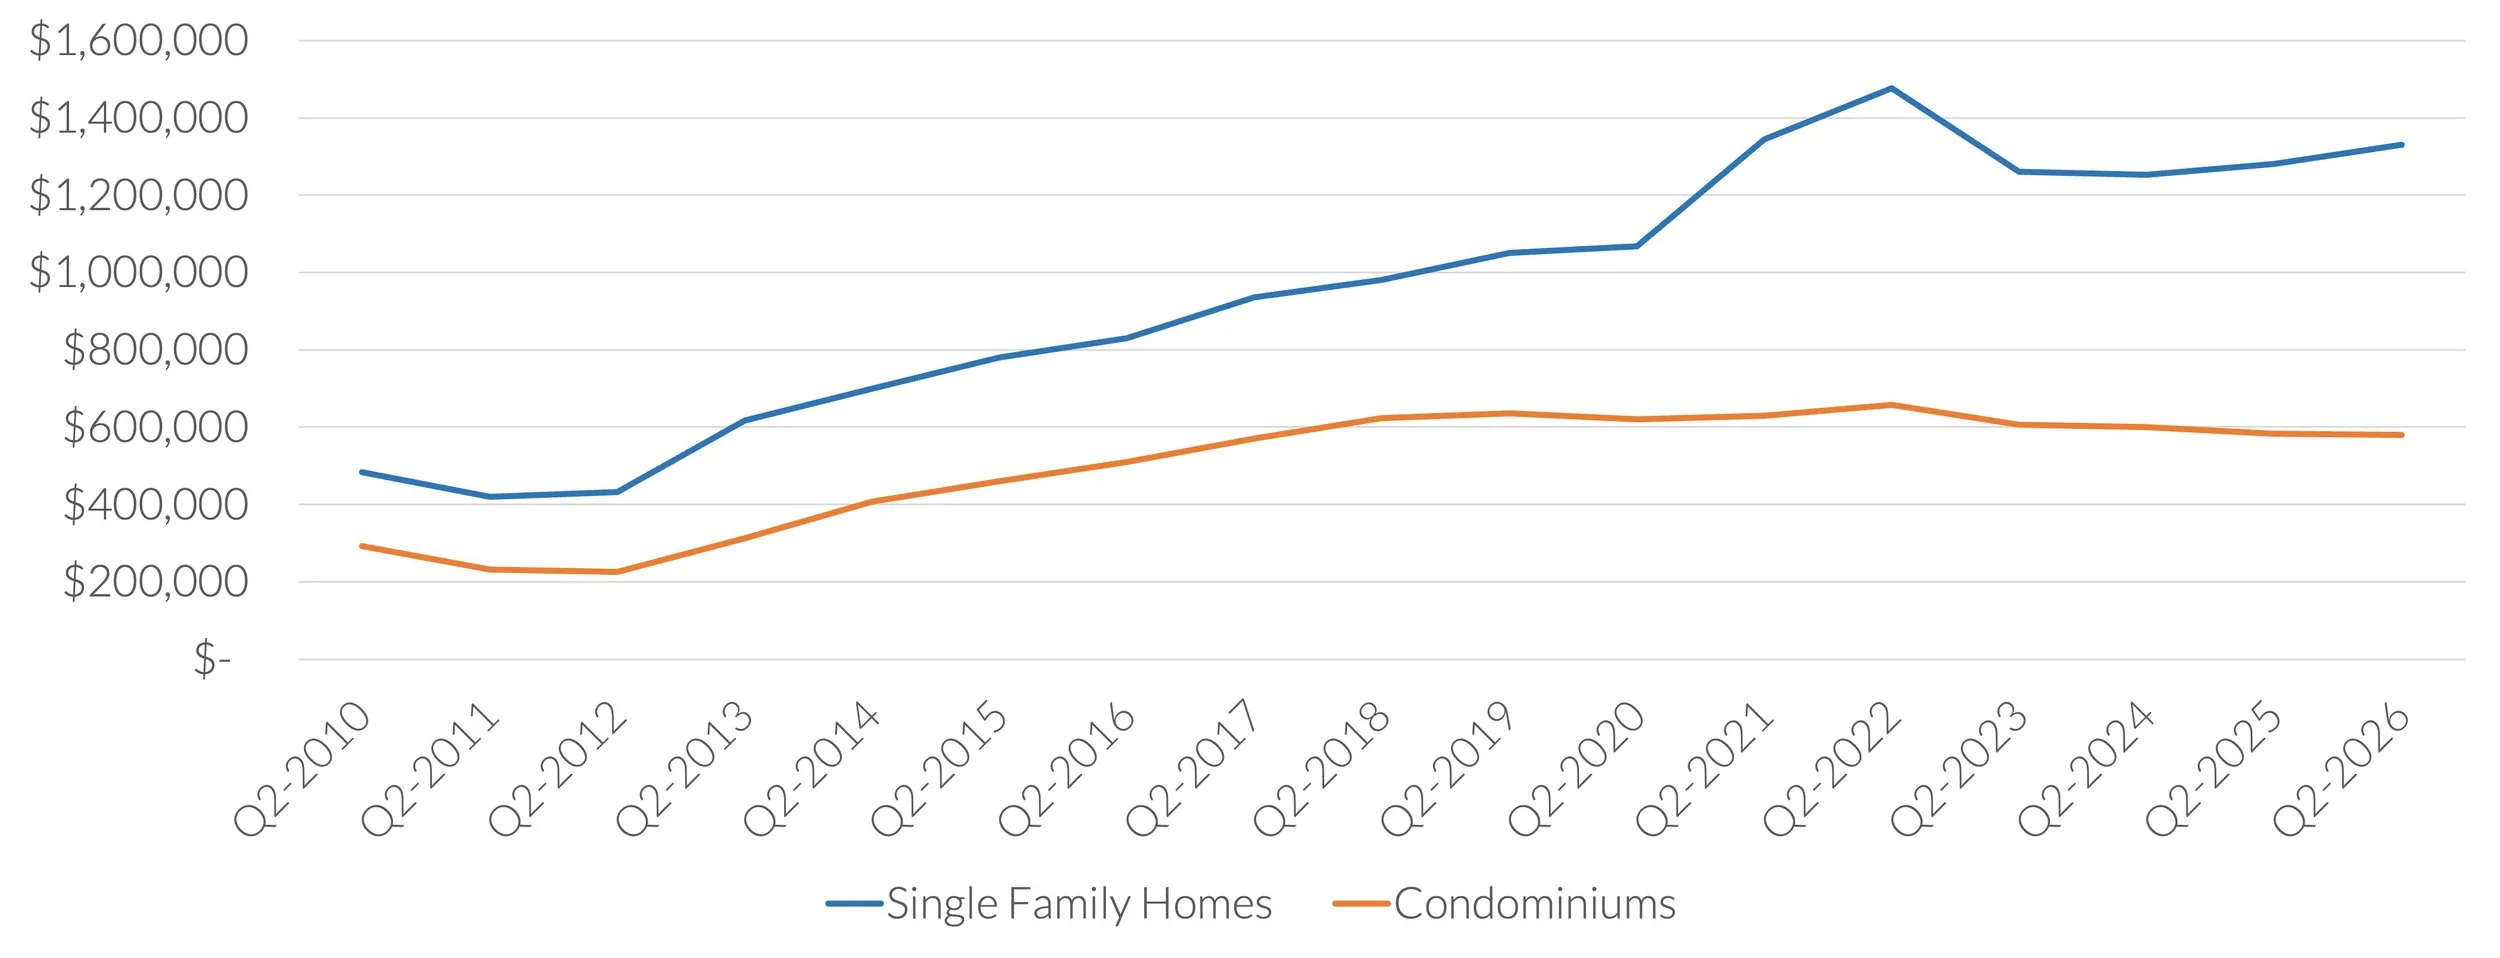
$1,330,000
+3.9% change year-over-year
$580,000
-0.4% change year-over-year
MEDIAN MARKET TIME
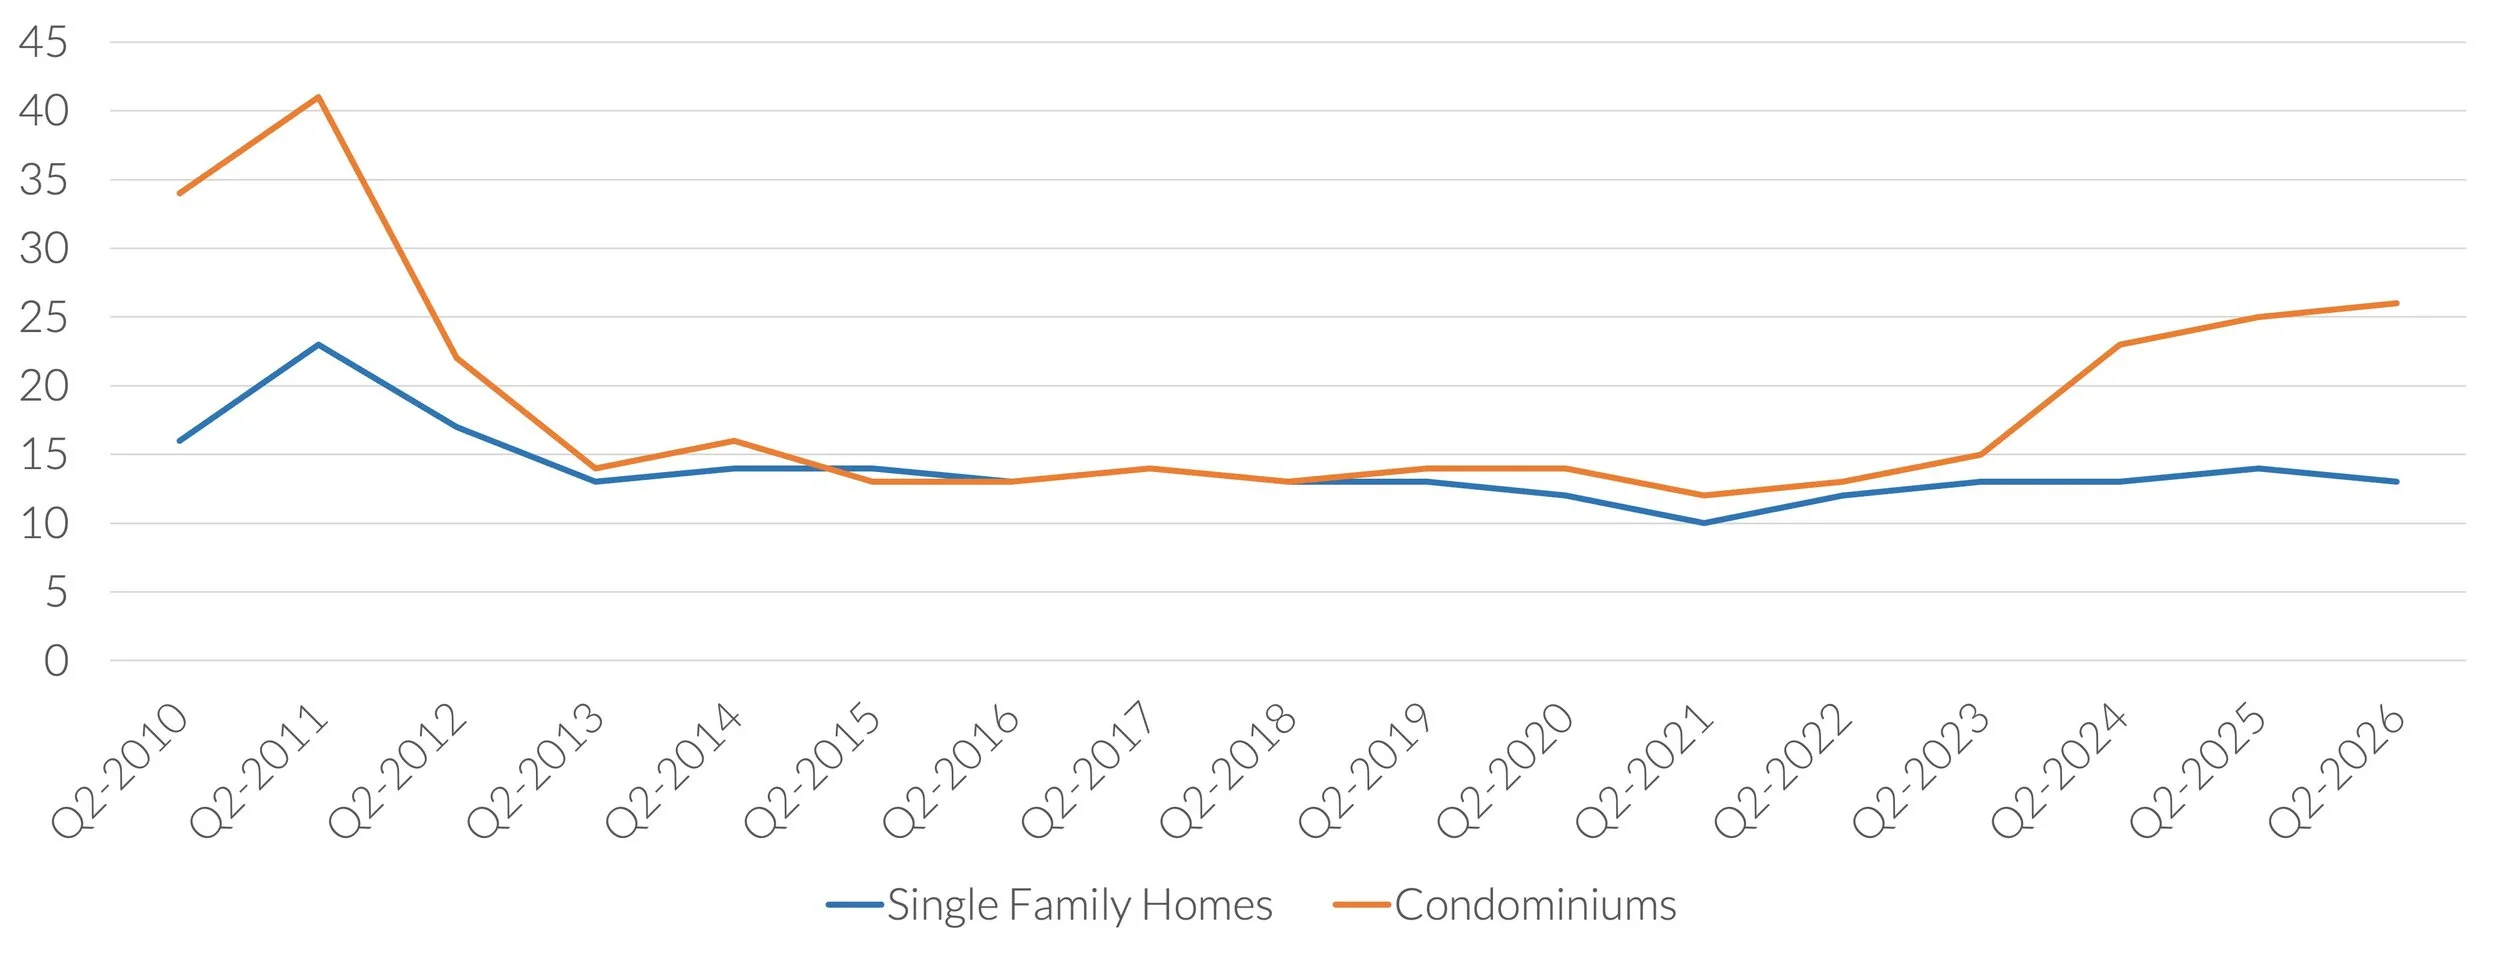
13 days
-1 day change year-over-year
26 days
+1 day change year-over-year
NUMBER OF SALES
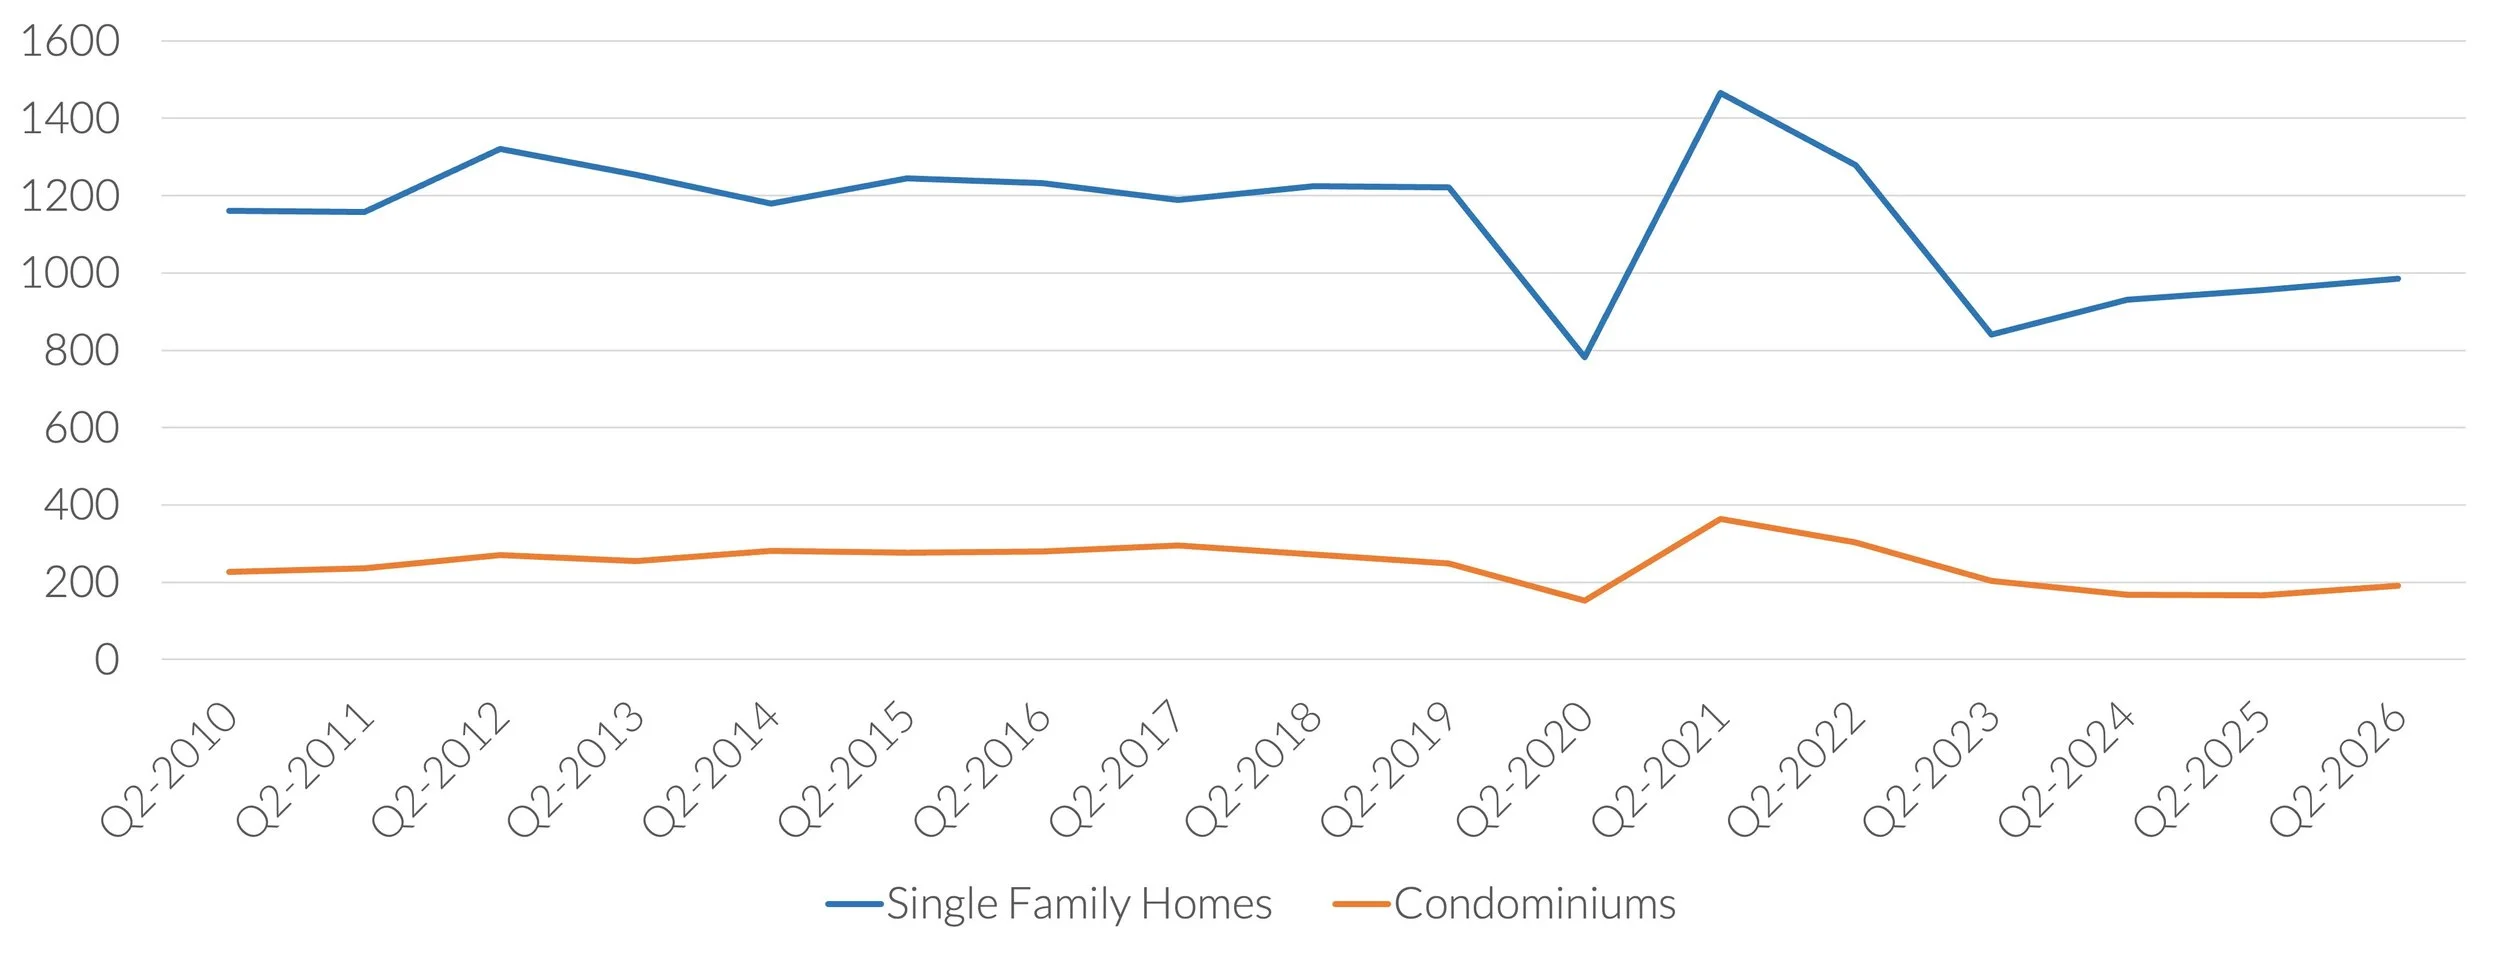

985
+3.1% change year-over-year

191
+15.1% change year–over–year
SEE ALL AVAILABLE REPORTS: