
April Market Update


Hi All,
We are about mid-way through our spring market now, and we've had the privilege of selling several listings already, so we feel we can start to report on how things are going so far this season.
Our recent experiences representing homes for sale in Berkeley, Kensington, Oakland, and Emeryville have all been very positive. Each of our recent listings has outperformed our original estimates, which were based on comparable sales from the recent past.
As you’ll read below in our recap of the First Quarter, overall inventory has continued to be constrained and although interest rates did pop back up over 6% again, buyers have been actively engaged and competing for well-priced and well-presented homes.
We currently have one active listing in Oakland, at 7403 Skyline Blvd - a stylishly updated 3 bedroom, 2.5 bath home with easy indoor-outdoor access and a location convenient to parks, trails and Montclair amenities. It’s a wonderful house!
Our team is also preparing a few more homes for this spring market, and we look forward to sharing these beauties with you soon. In addition, we have two wonderful properties that are currently pending after receiving several competitive offers, and we couldn't be more thrilled for our clients!
As always, we are here for you if you’re thinking about selling, if you are looking for a new home for your next chapter, and also if you are considering making some changes to your current property. We love to talk about design, about what kinds of upgrades buyers appreciate and will add resale value, and/or if you need a resource for a trusted tradesperson or two.
Please reach out - we love to hear from you!
Warmly,
Corey, Maria, Anita and Carla
INNER EAST BAY MARKET UPDATE

Q1 2026 WRAP-UP
The Inner East Bay housing market is carrying strong momentum into 2026, defined by tightening inventory, rising competition, and steady pricing despite a higher-rate environment. While national headlines point to a more mixed housing landscape, the Inner East Bay continues to stand out as a supply-constrained, demand-driven market, supported by resilient local fundamentals and improving buyer confidence.
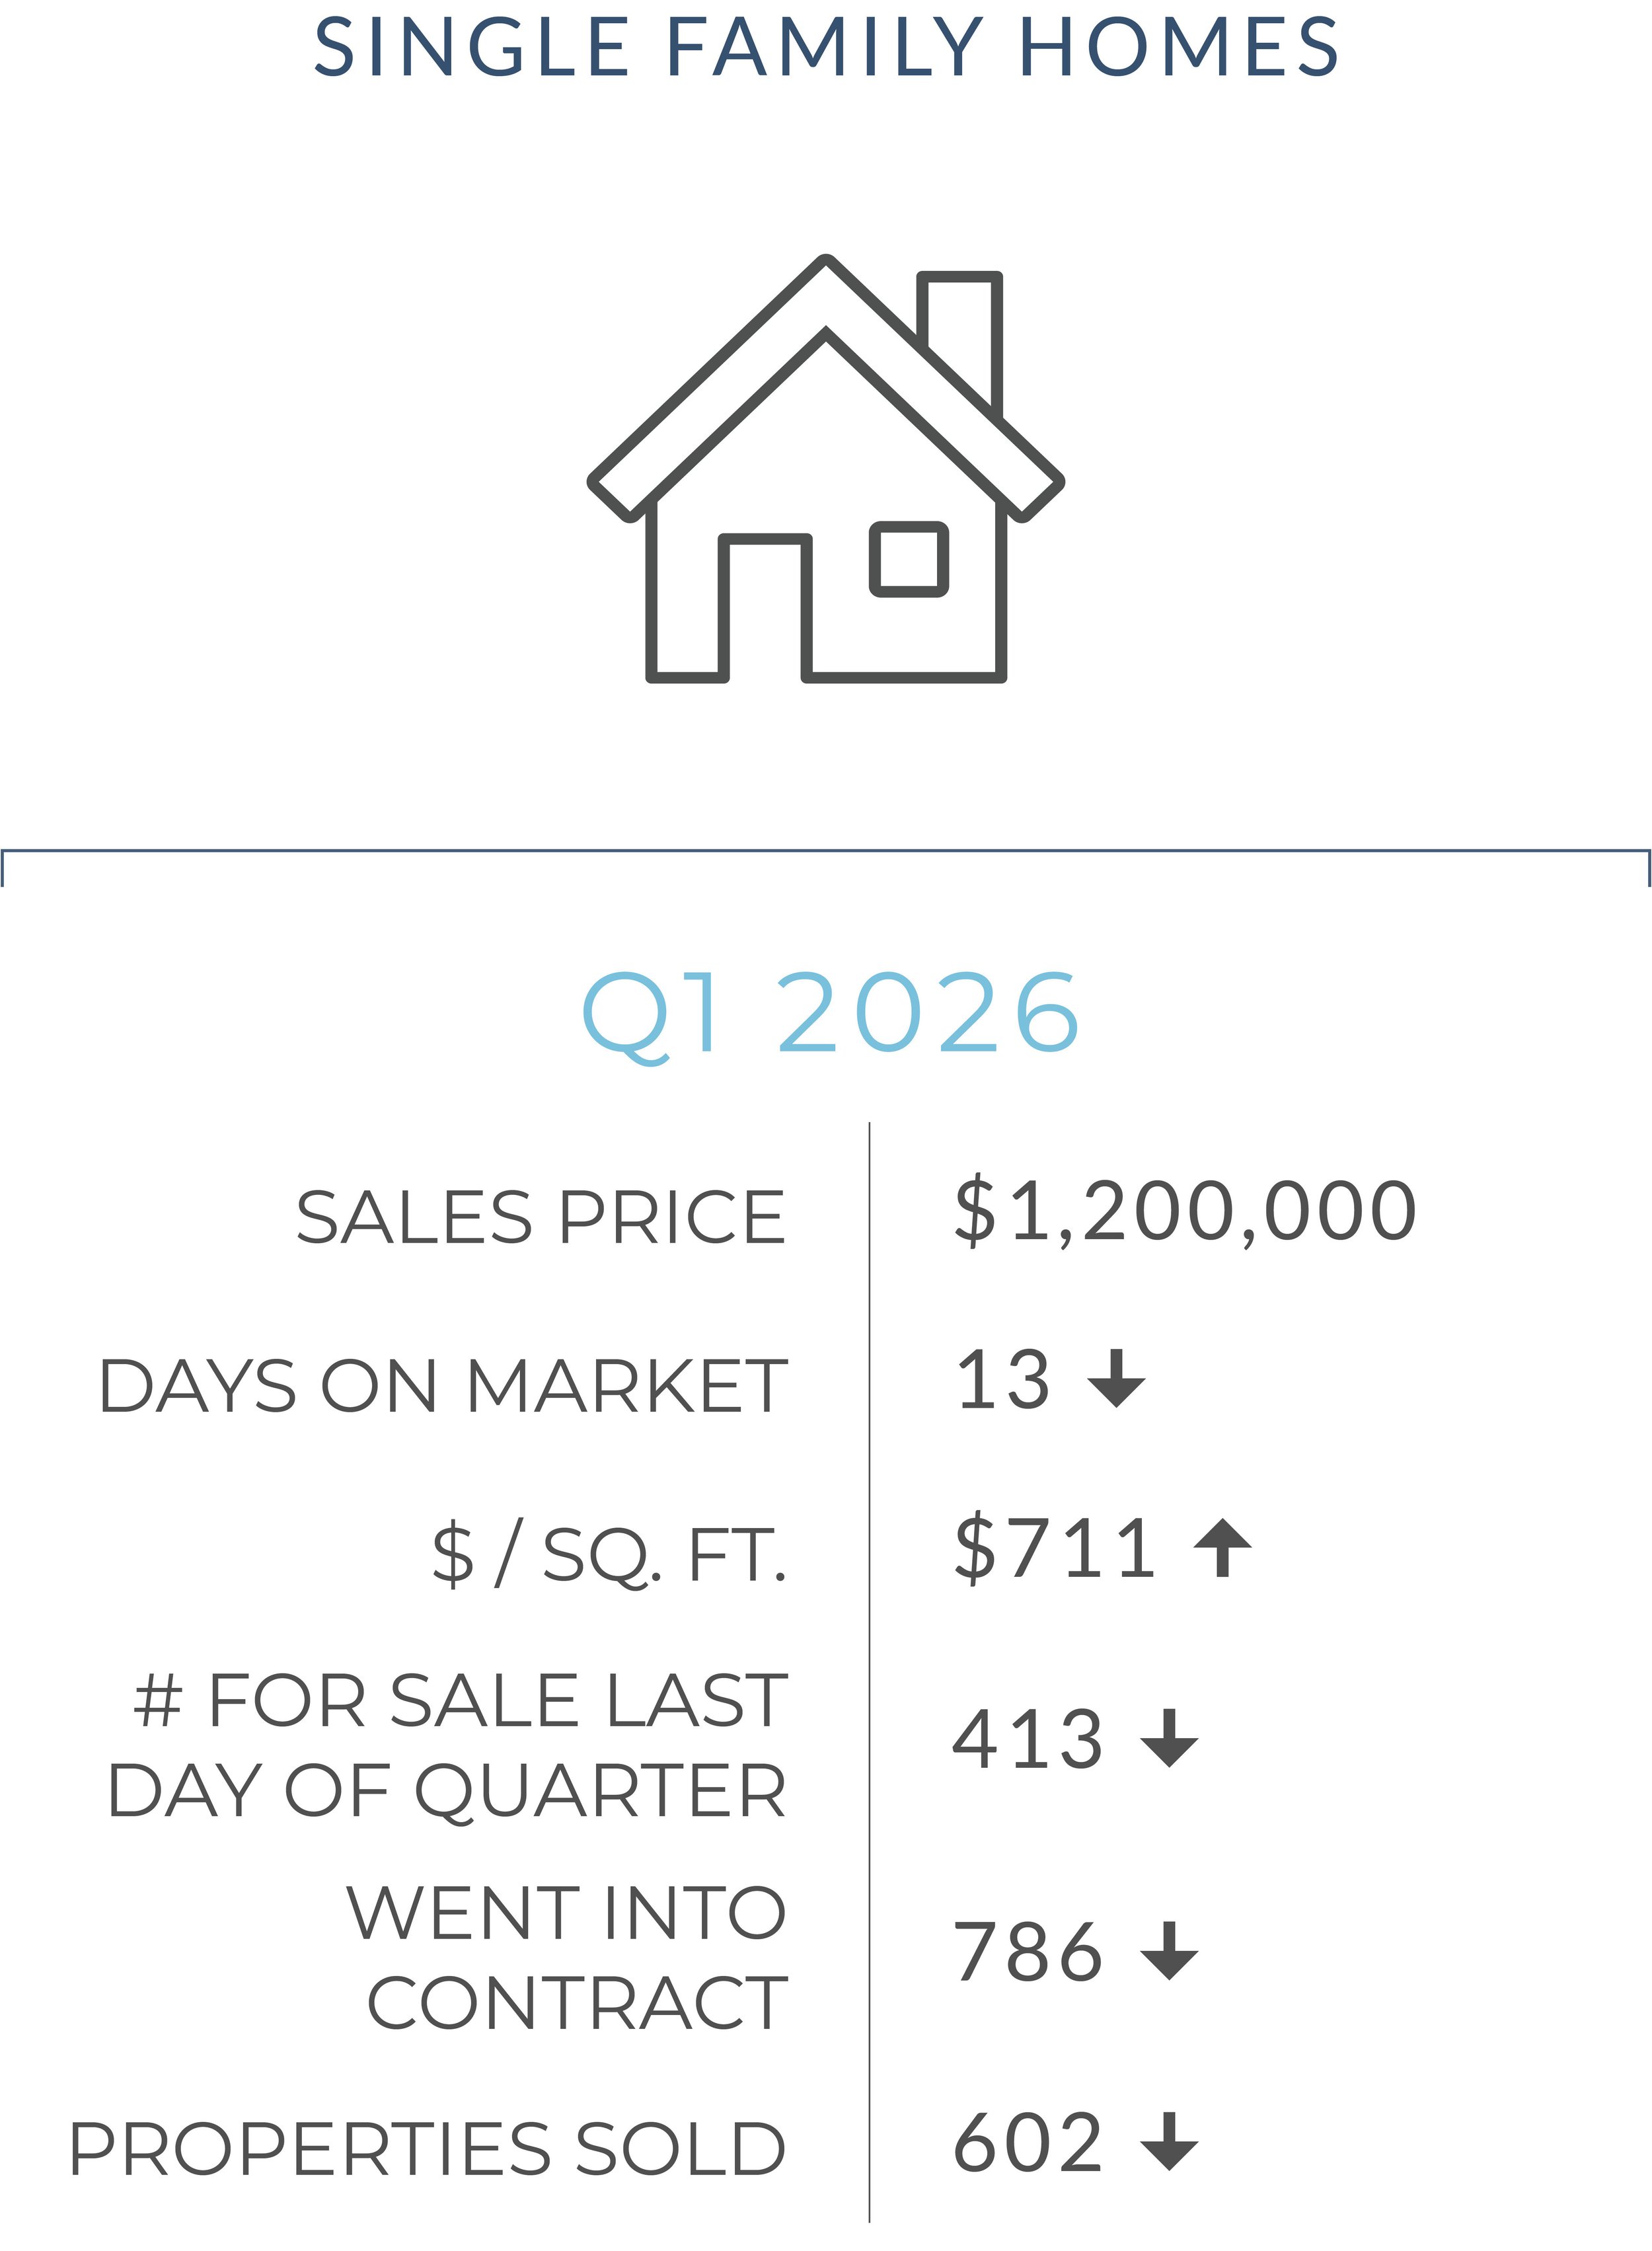
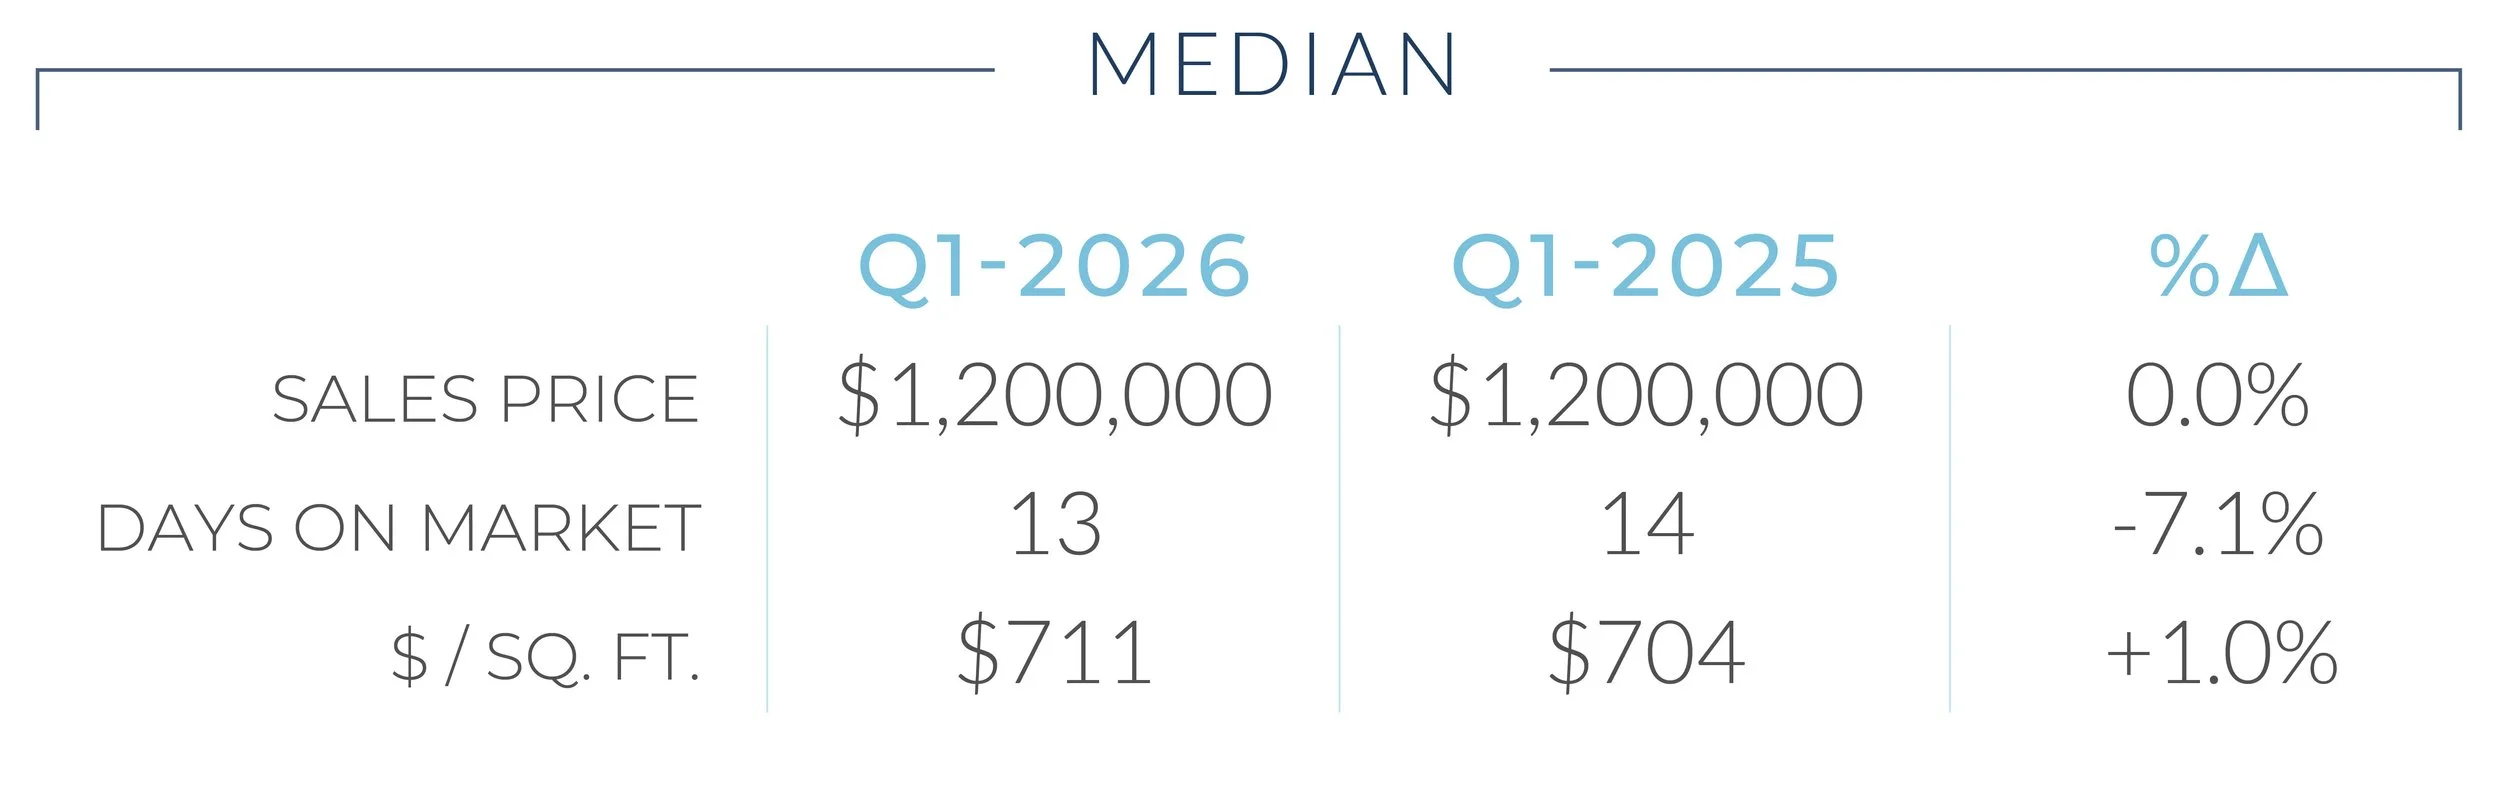
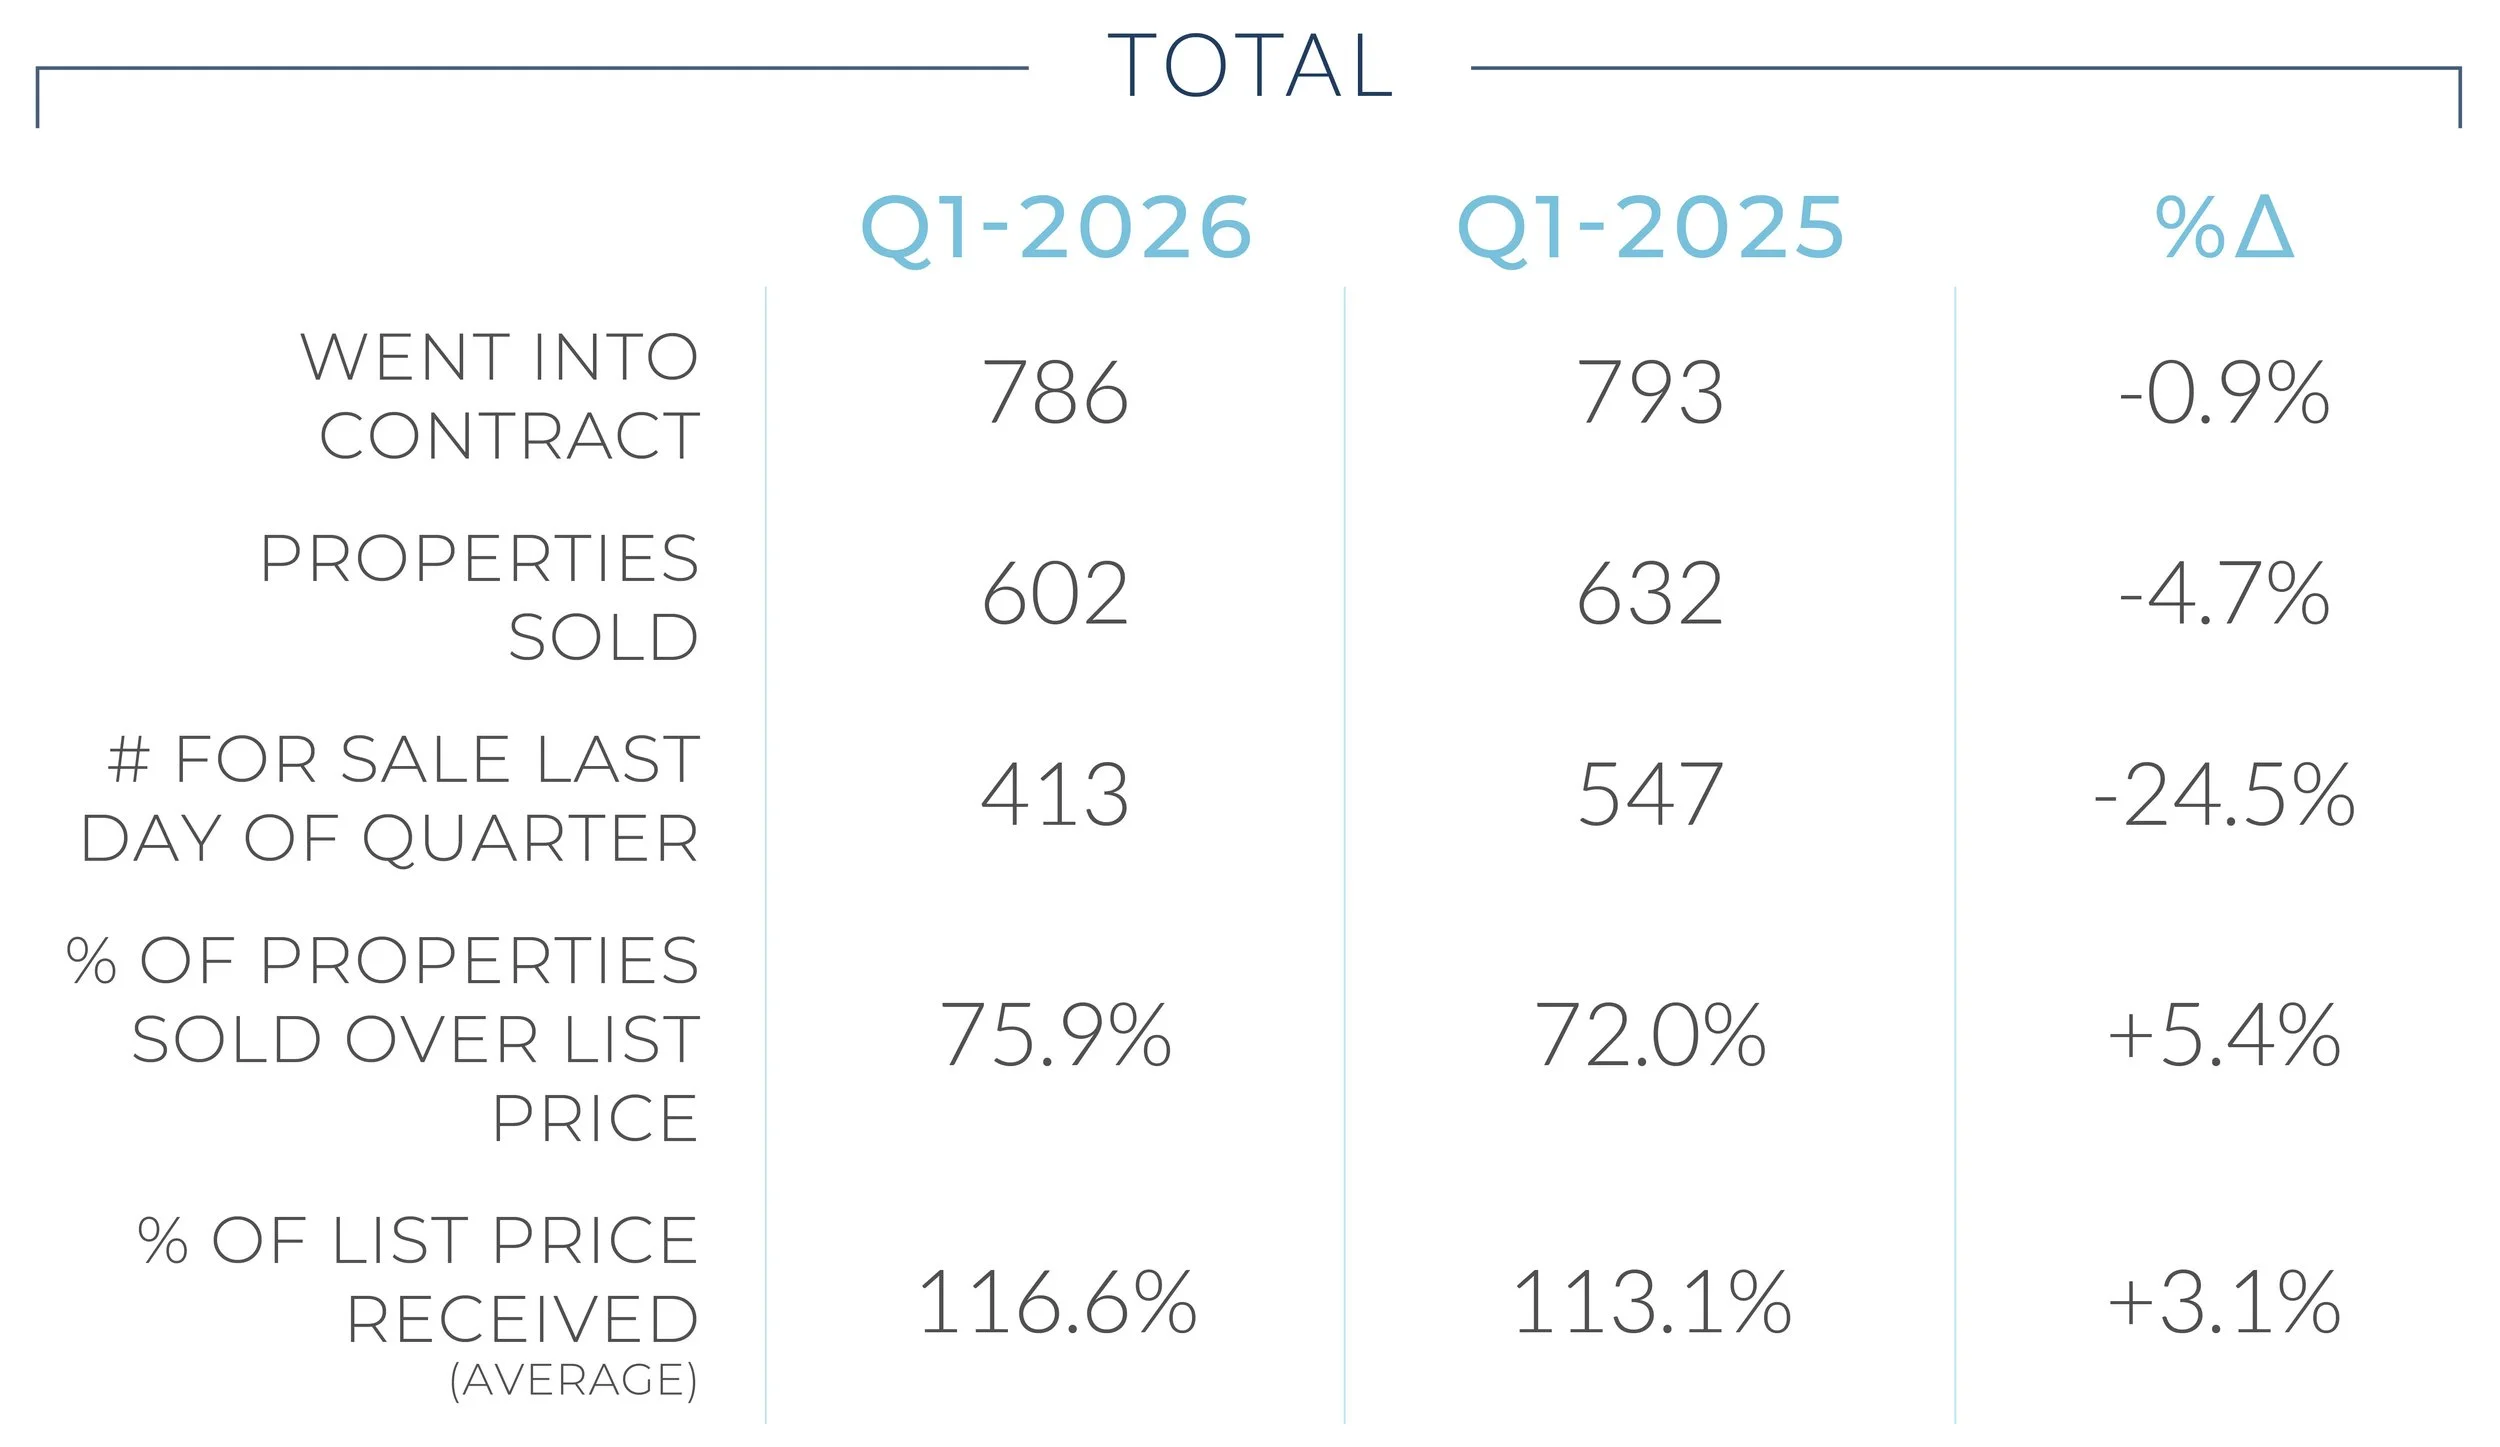
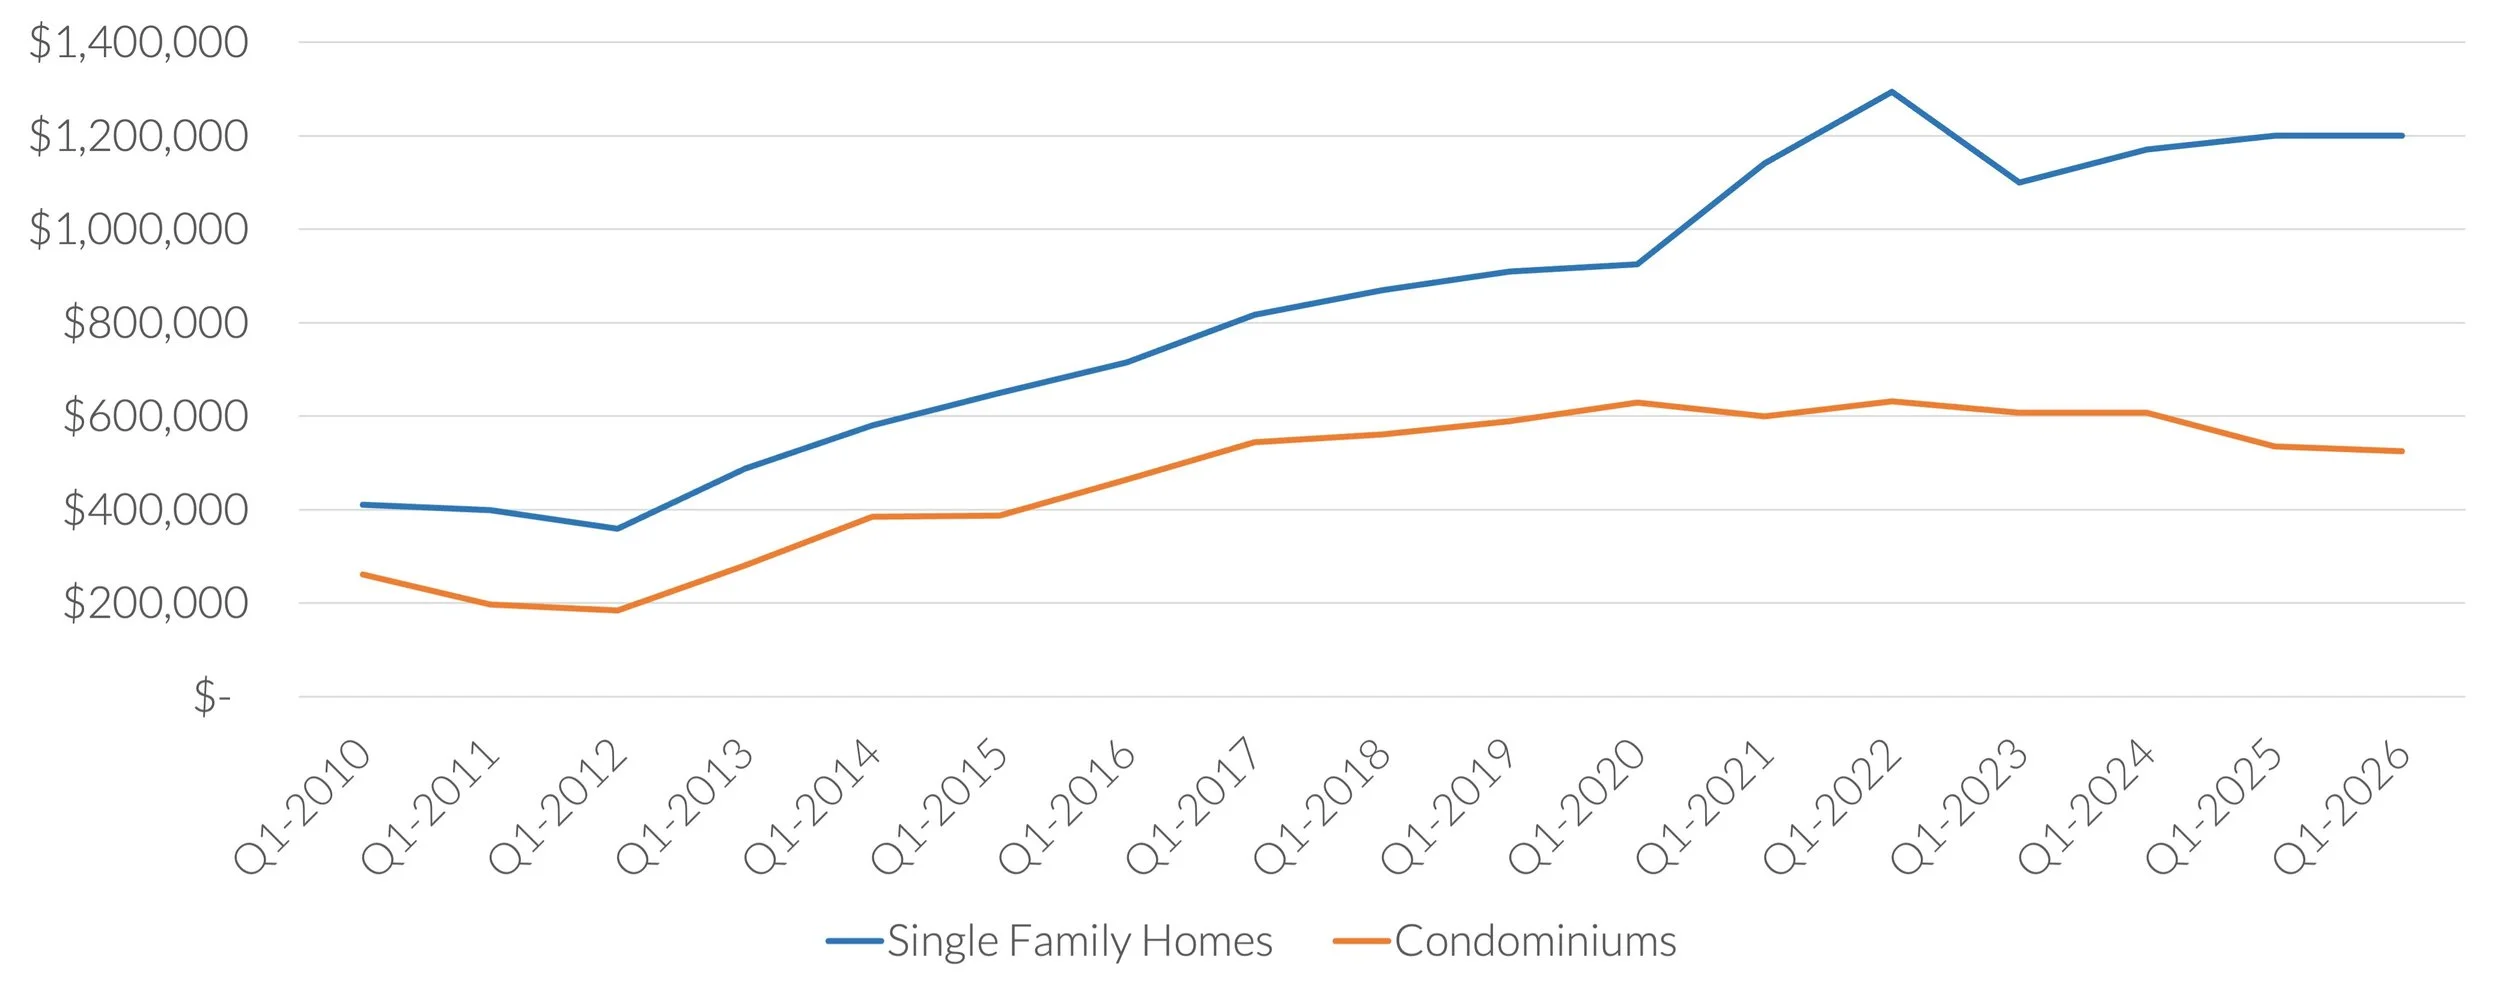
Single-family homes continue to lead. Inventory dropped 24.5% year over year, one of the most notable shifts this quarter, fueling stronger competition. 75.9% of homes sold above asking, up 5.4%, and sellers received an average of 116.6% of list price, up 3.1%. Prices held firm at $1,200,000, with price per square foot up 1.0%, and homes moved quickly in just 13 days. While sales volume dipped slightly, this appears to be a supply issue, not a demand issue.
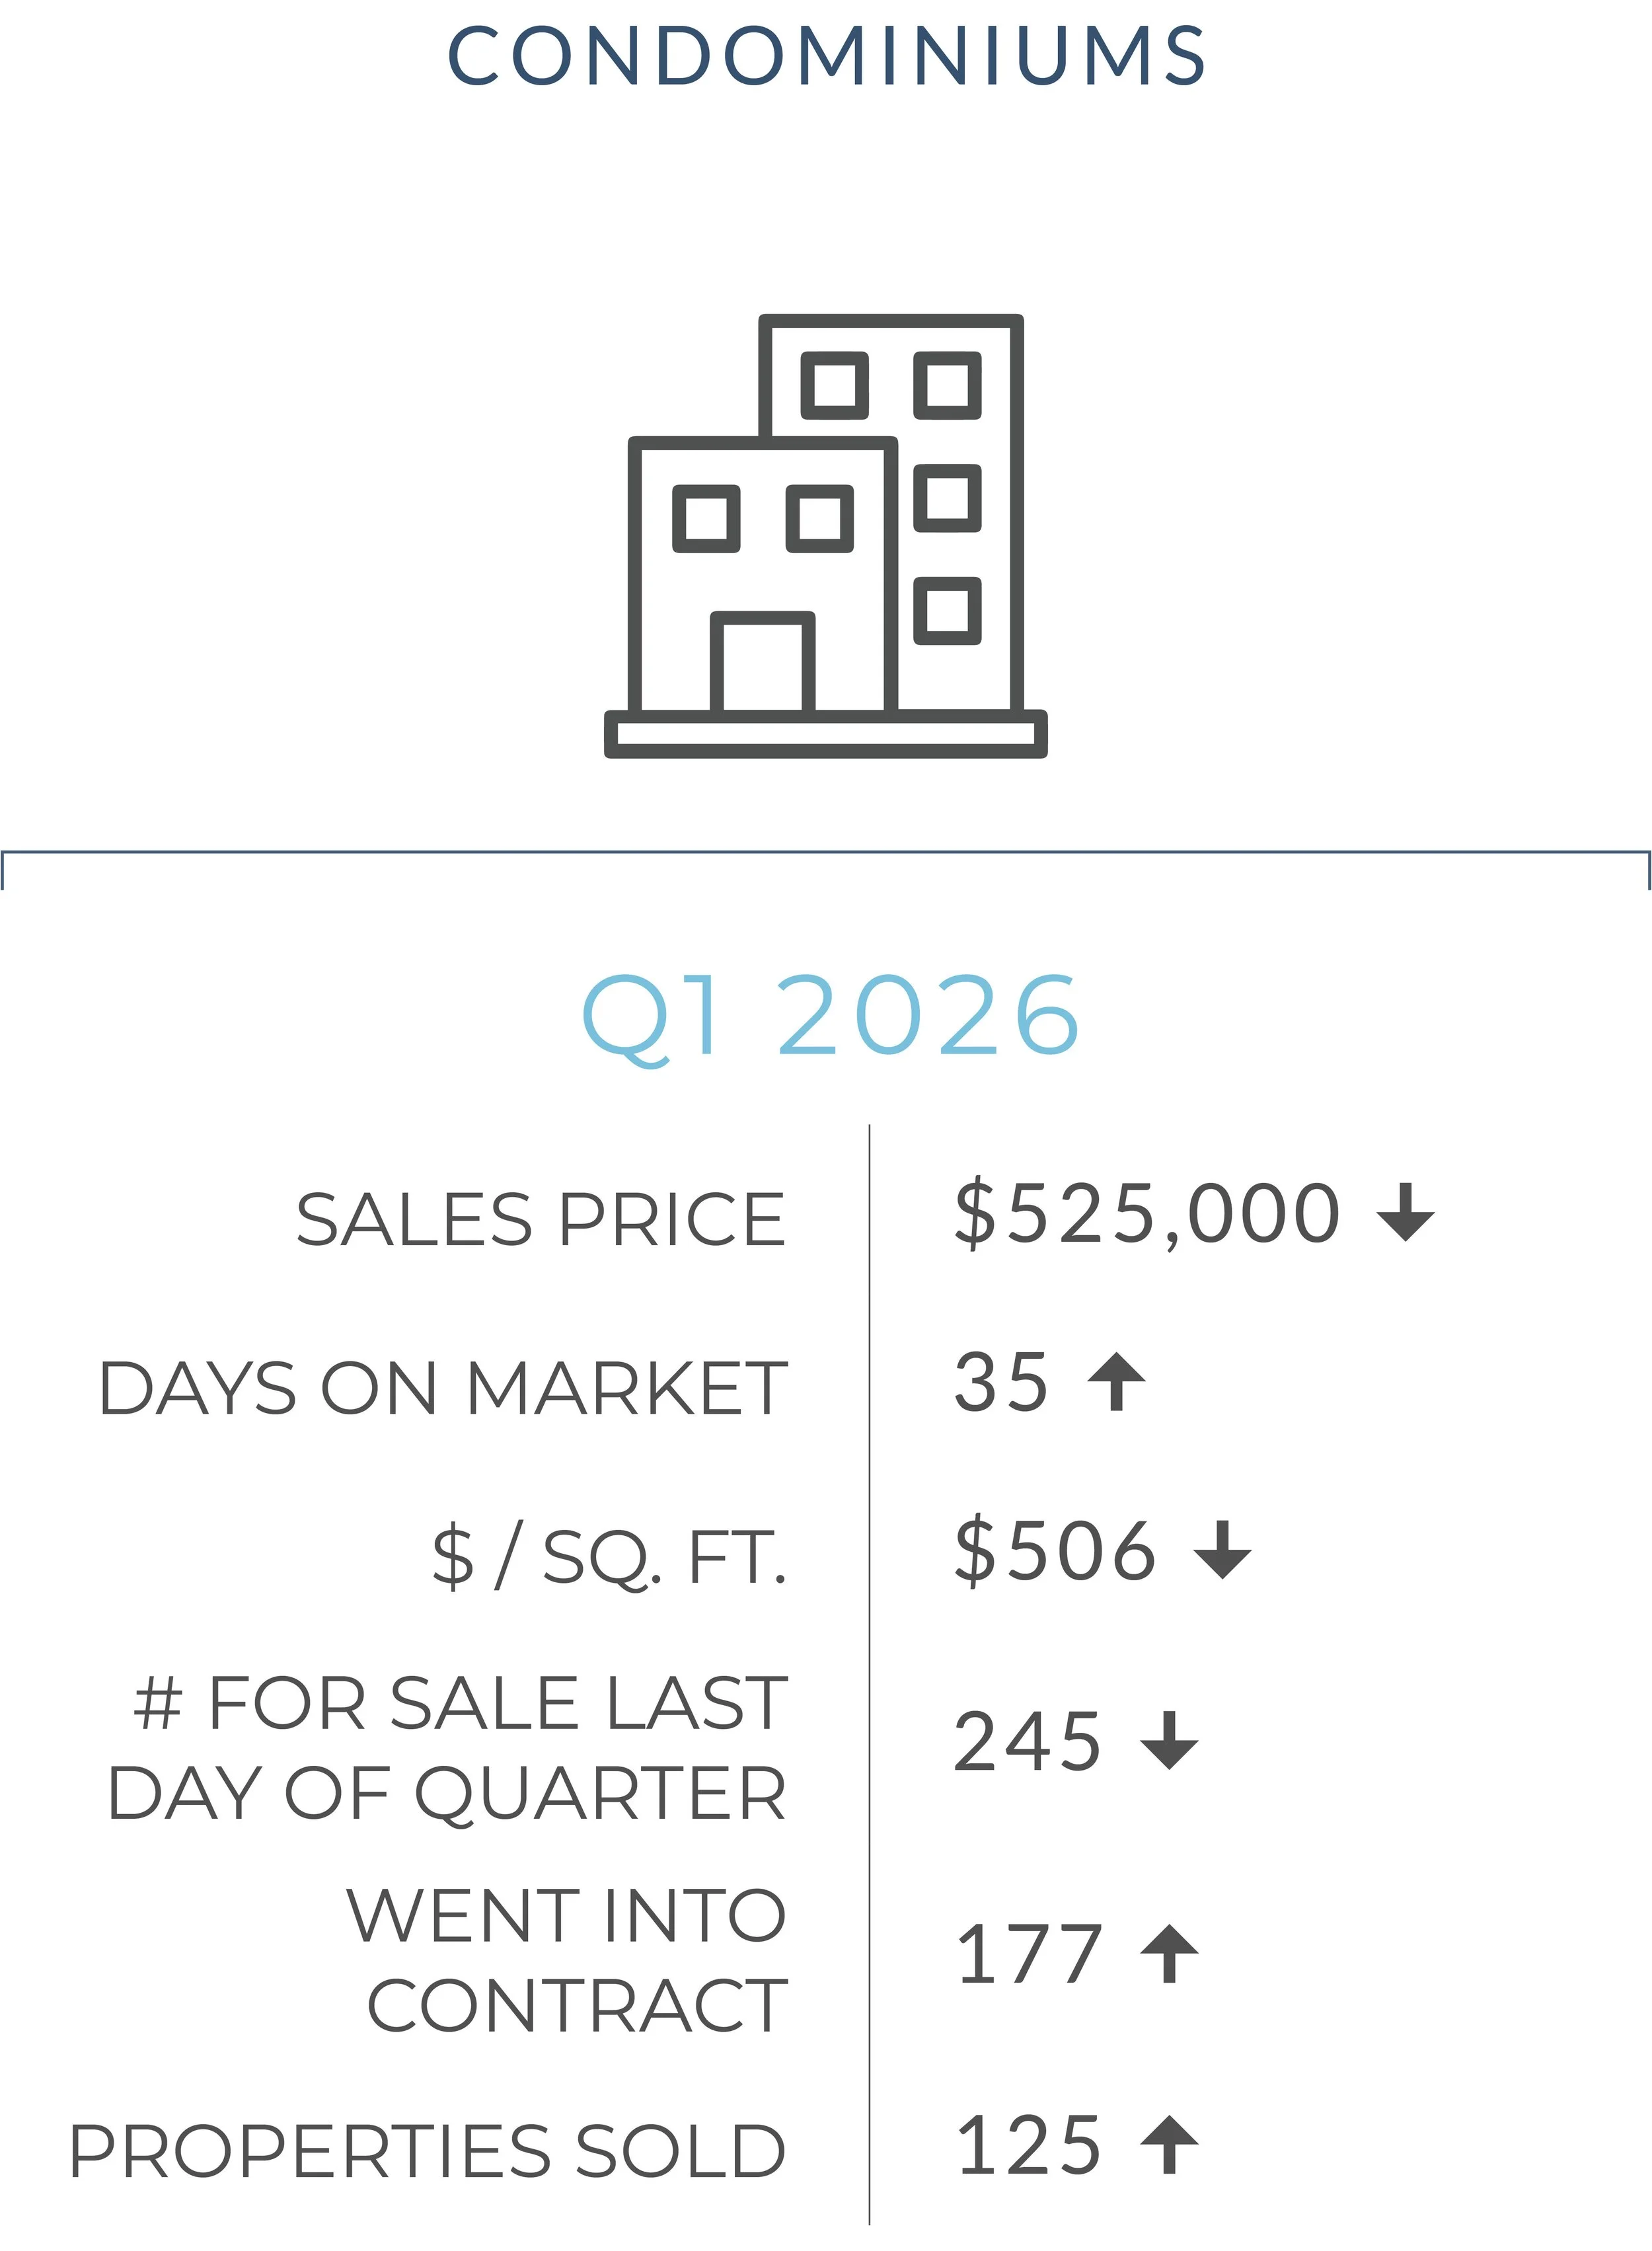
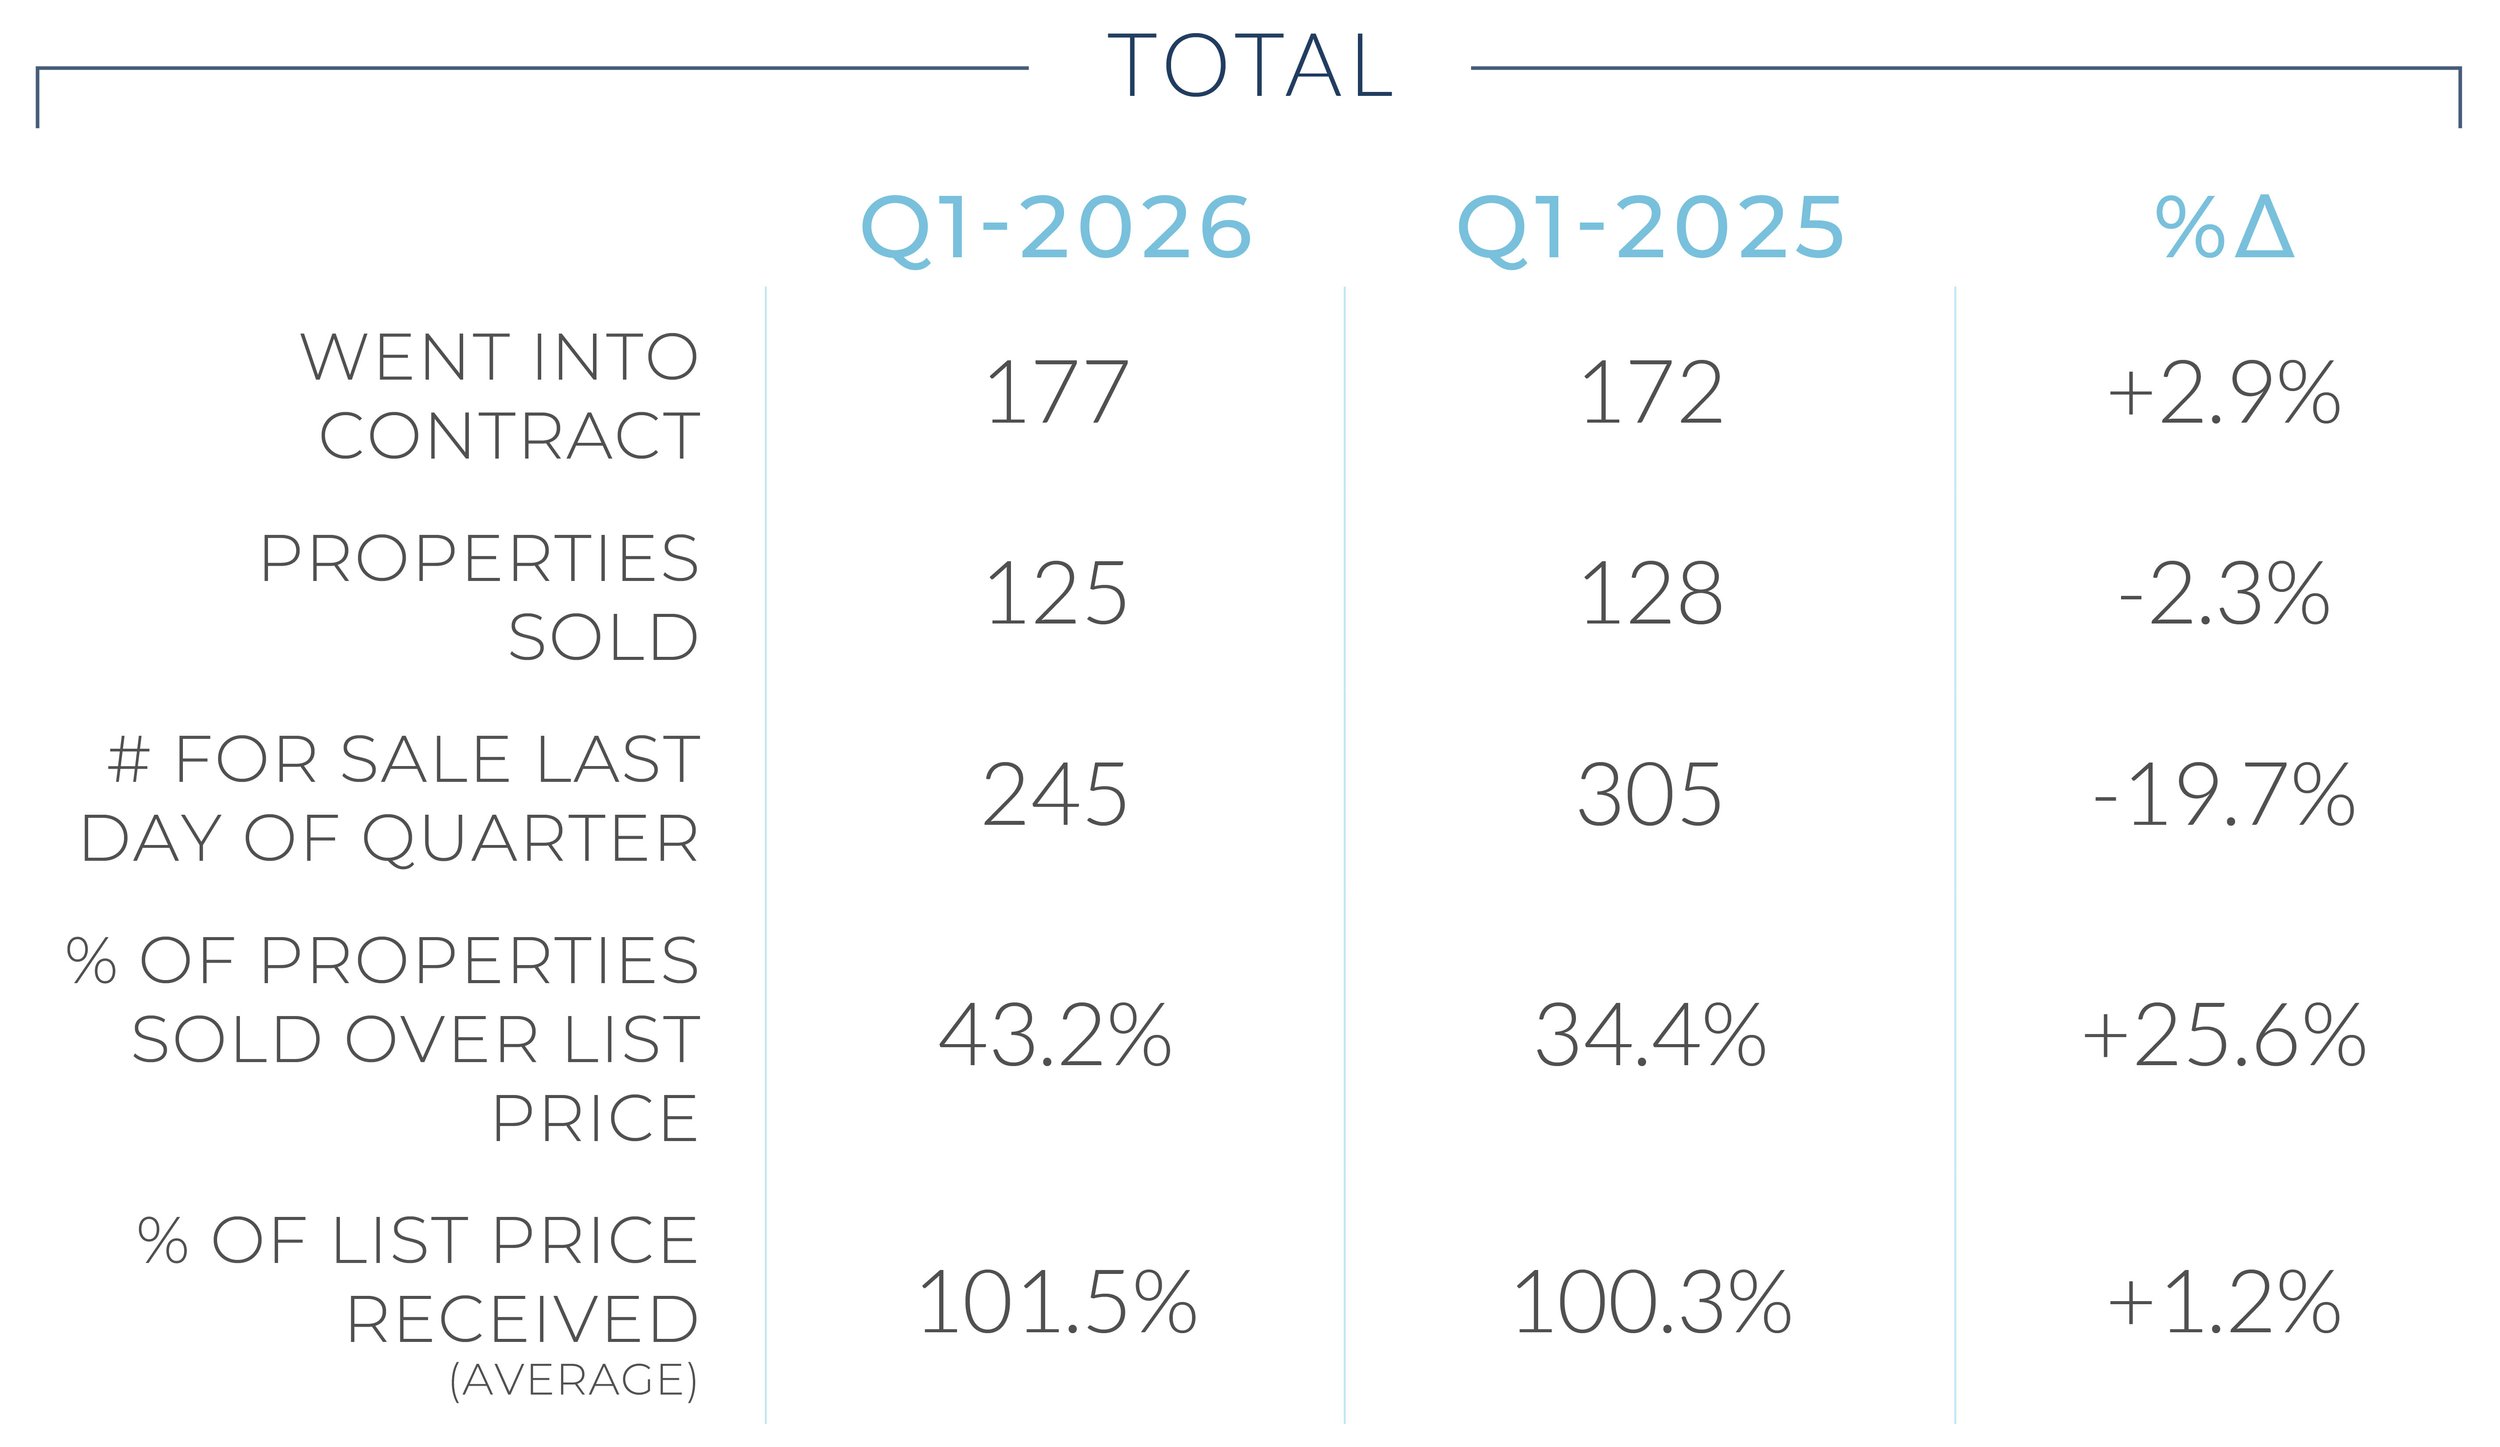
The condo market is showing early signs of a rebound. While prices softened modestly, competition improved significantly. The percentage of condos selling above asking jumped 25.6% year over year to 43.2%, and sellers averaged 101.5% of list price. Inventory declined 19.7% and contracts rose 2.9%, pointing to improving demand, even as homes took longer to sell.
The bigger picture remains supportive. Inventory constraints and a strong local employment base continue to underpin demand, even as mortgage rates have remained volatile in recent weeks.
Looking ahead, the outlook for the spring market is strong. Limited supply and improving demand should continue to drive competition, with single-family homes leading and condos gaining traction as affordability improves.
SOME OF OUR RECENT LISTINGS


YEAR-OVER-YEAR COMPARISON
SINGLE FAMILY RESIDENCES
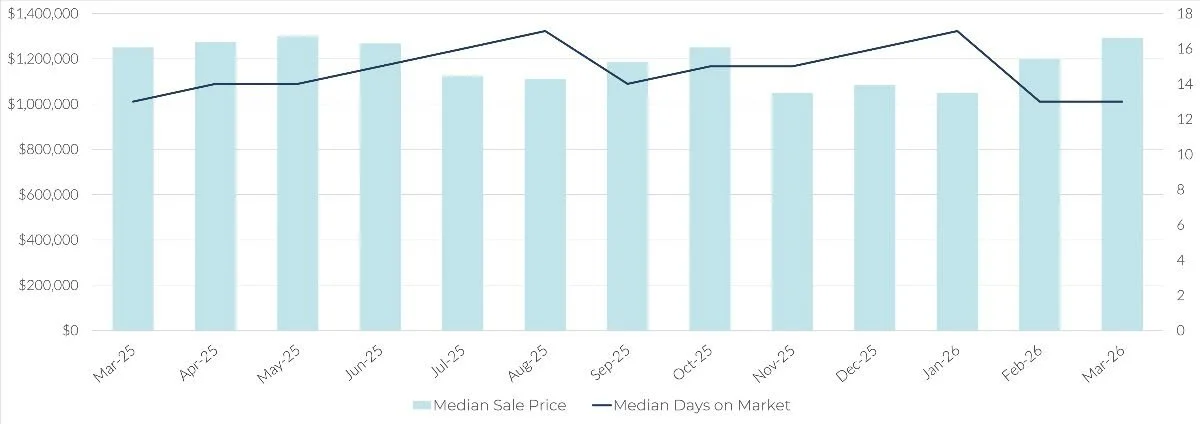
MONTH-OVER-MONTH COMPARISON
SINGLE FAMILY RESIDENCES
CHANGE IN PAST MONTH:
SALES PRICE
+7.6%
DAYS ON MARKET
No change
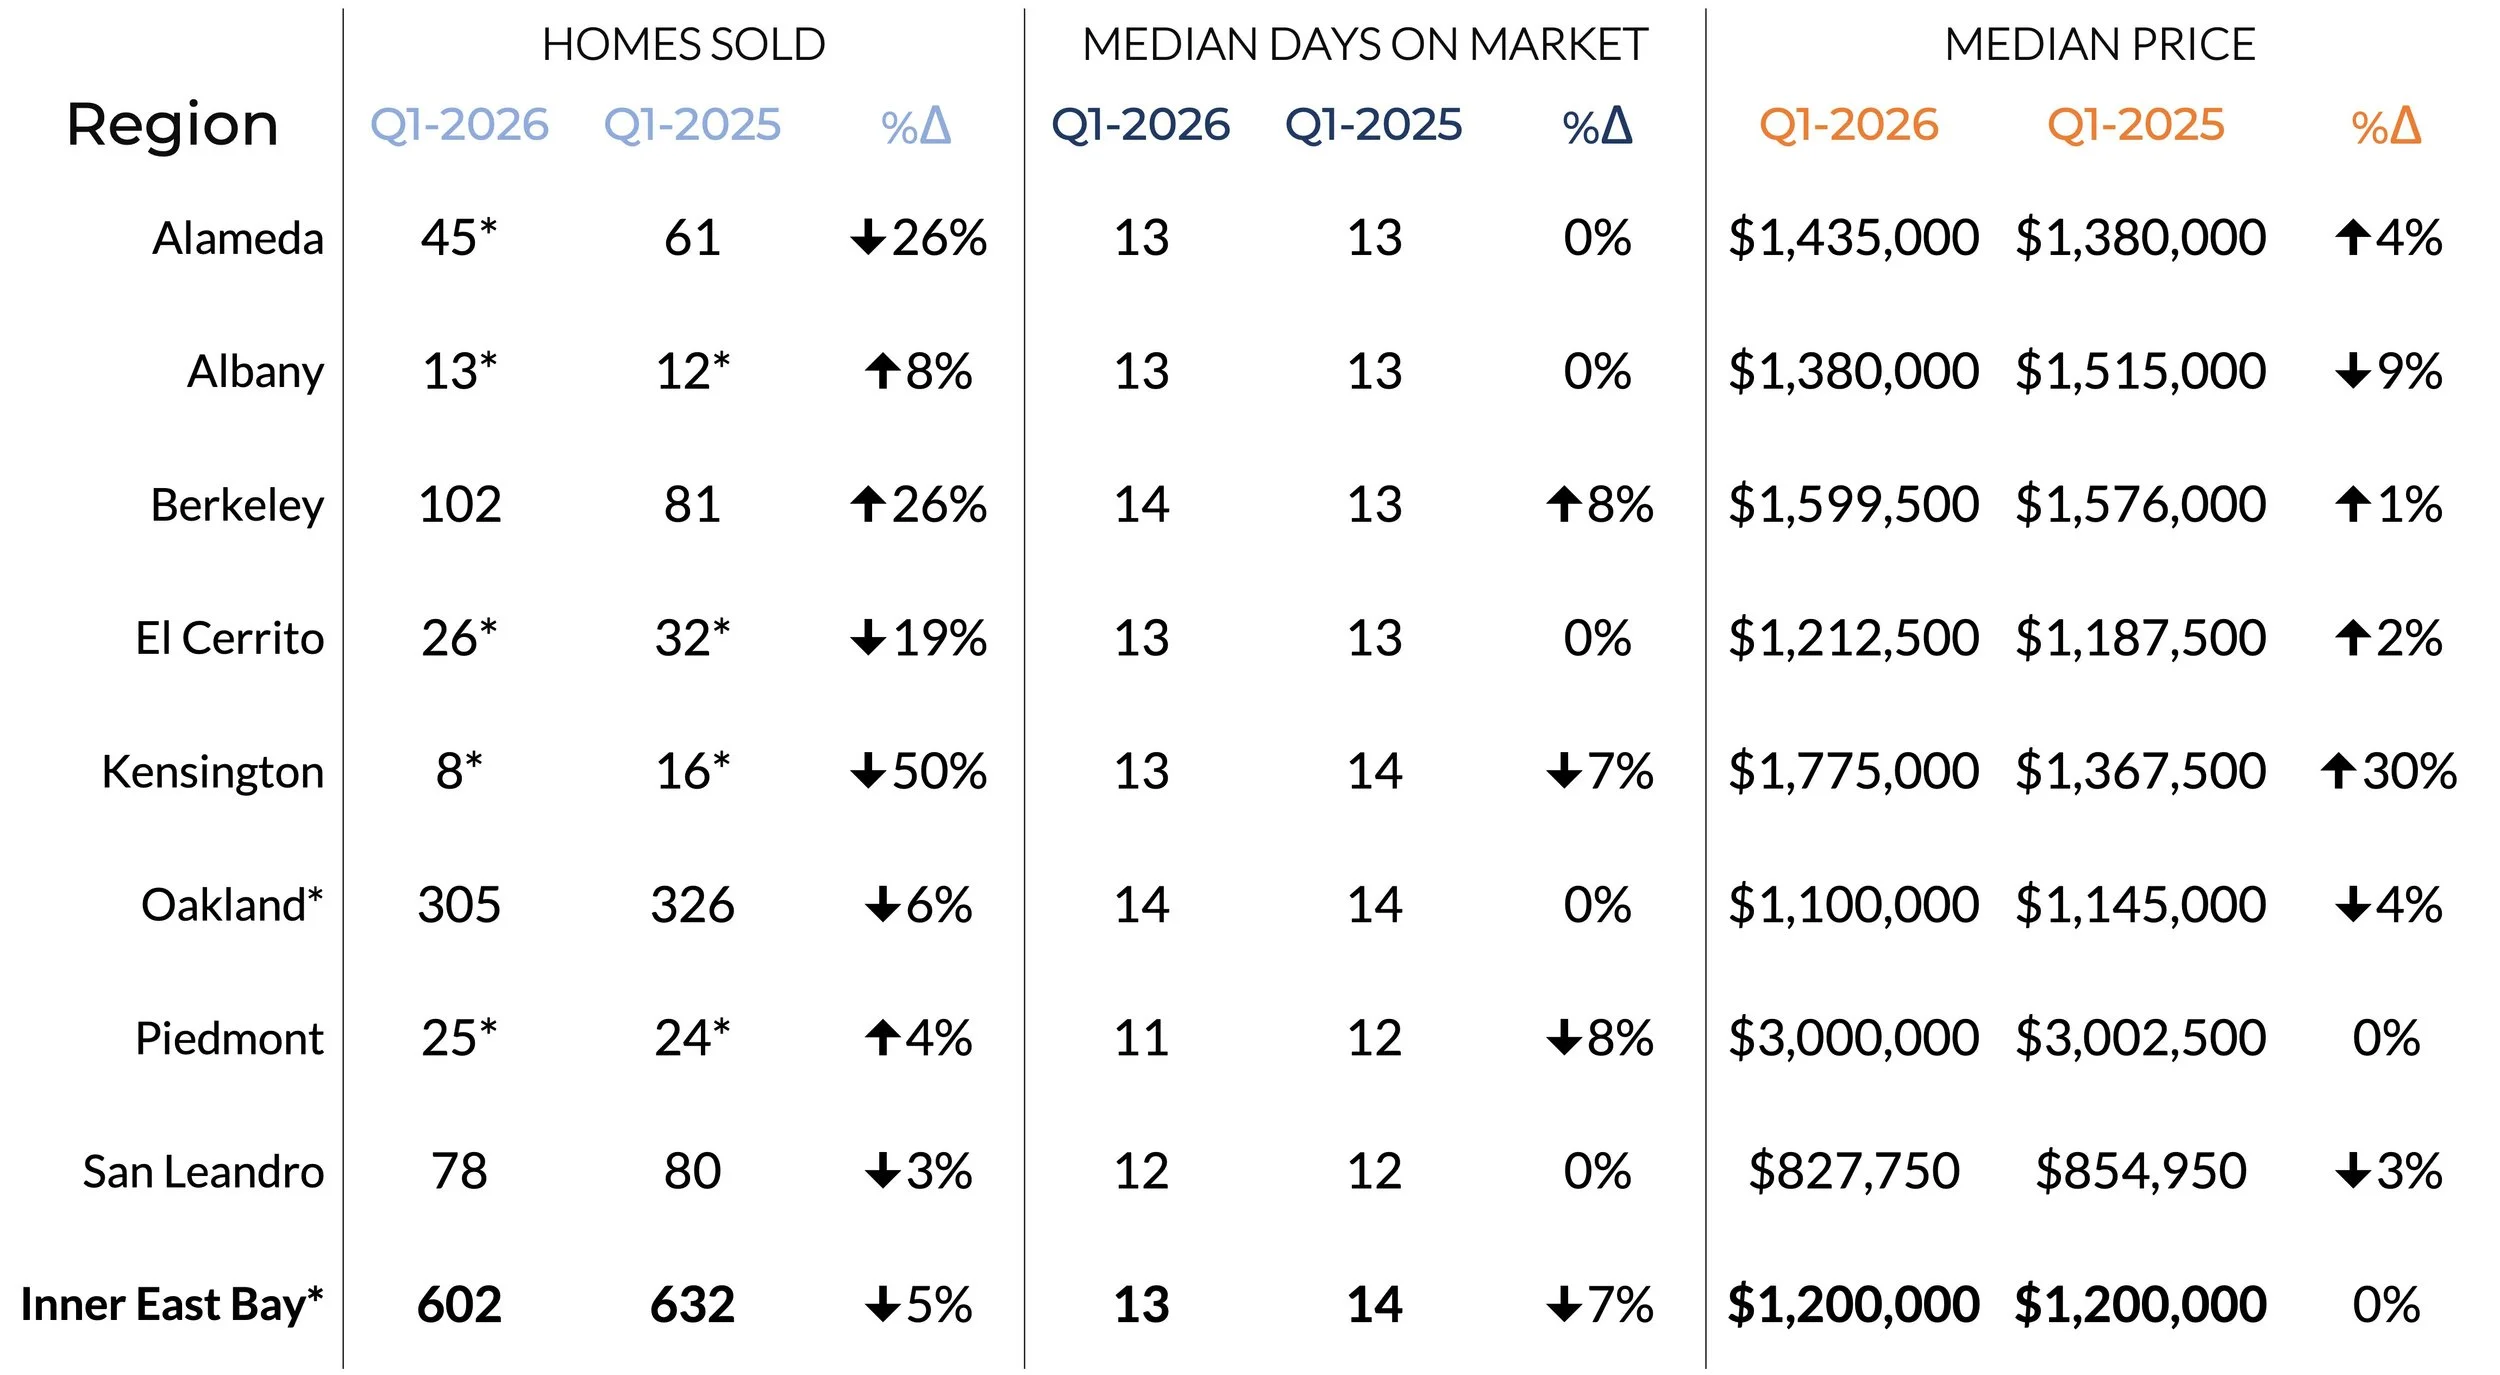
MEDIAN AREA VALUES
SINGLE FAMILY RESIDENCES
Q1 2026
YEAR-OVER-YEAR COMPARISON
CONDOMINIUMS
MONTH-OVER-MONTH COMPARISON
CONDOMINIUMS
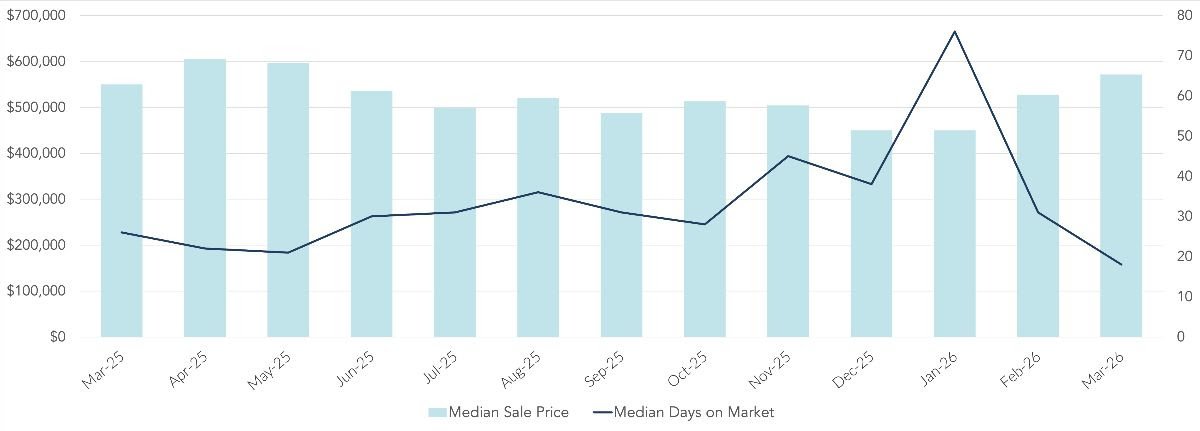
CHANGE IN PAST MONTH:
SALE PRICE
+8.3%
DAYS ON MARKET
-13 days
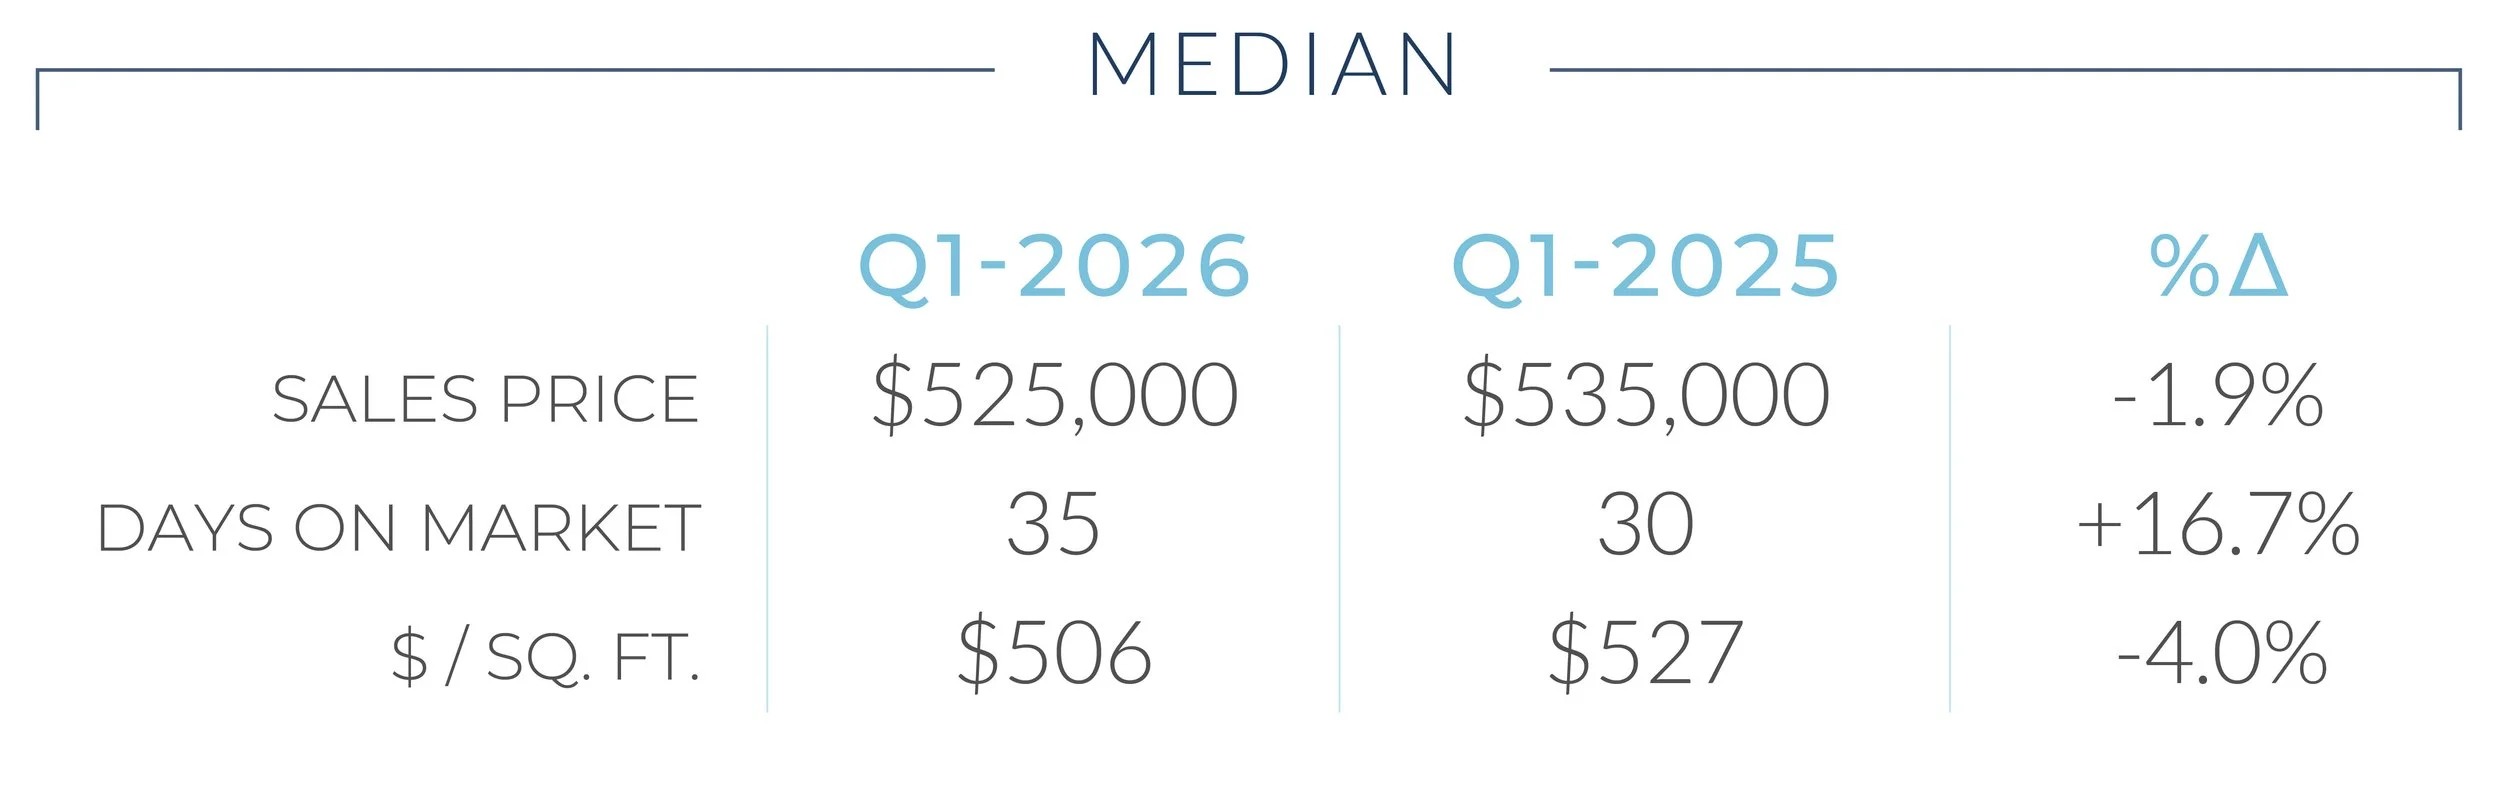
MEDIAN AREA VALUES
CONDOMINIUMS
Q1 2026
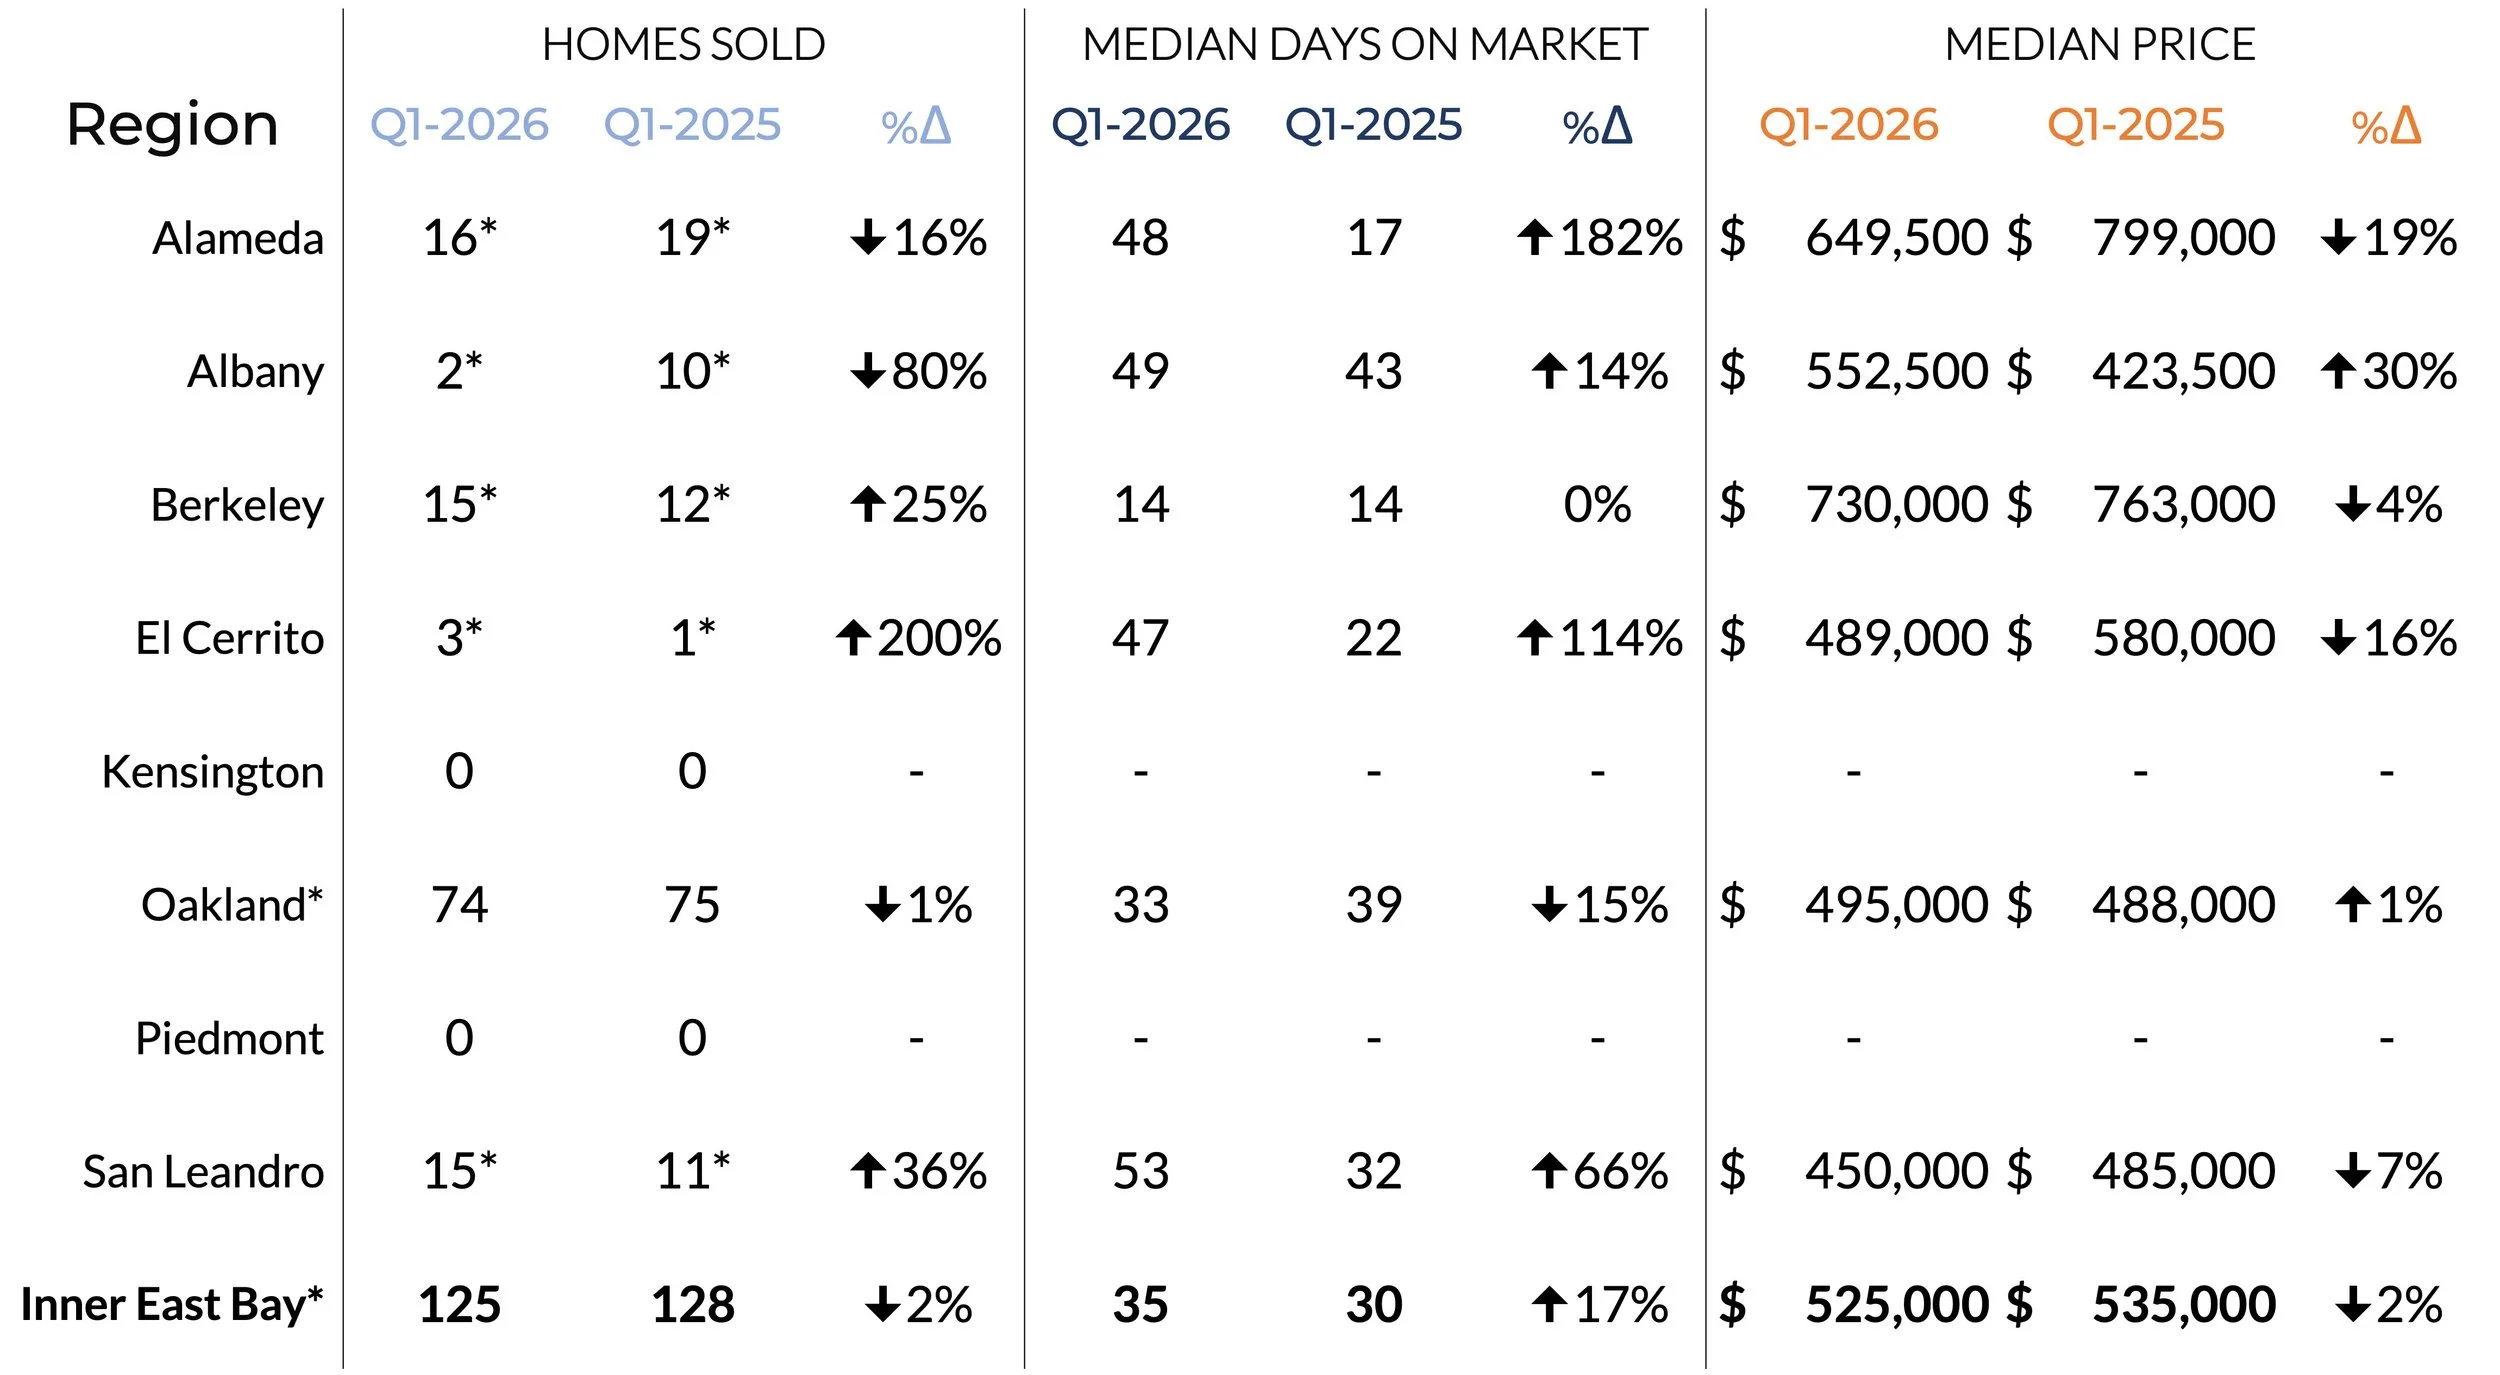
** Denotes small sample size; Use caution when interpreting results.
YEAR-OVER-YEAR COMPARISONS
MEDIAN SALE PRICE

$1,250,000
No change year-over-year

$525,000
-1.9% change year-over-year
MEDIAN MARKET TIME
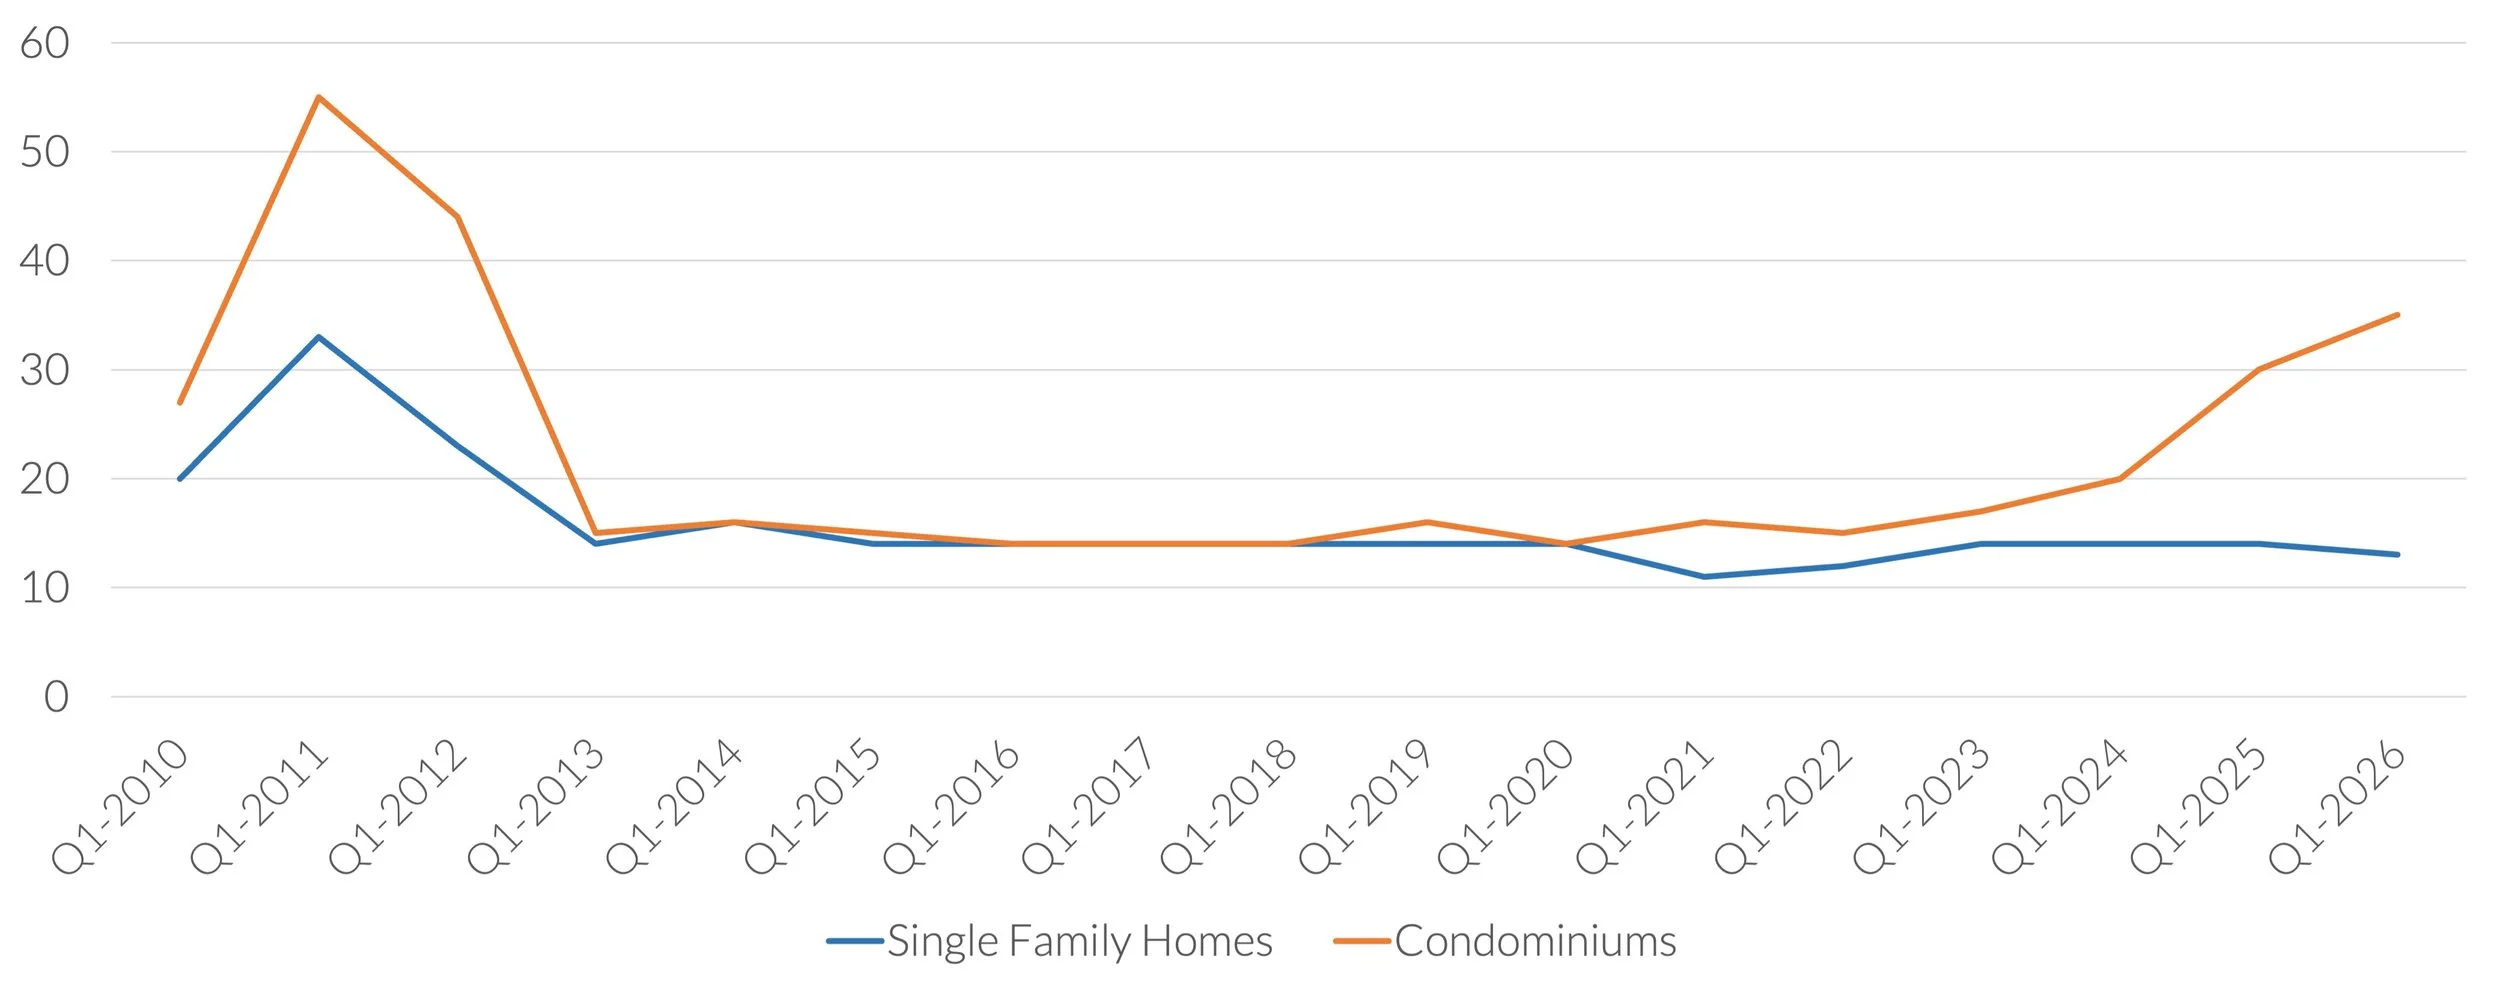
13 days
-1 day change year-over-year
35 days
+5 day change year-over-year
NUMBER OF SALES
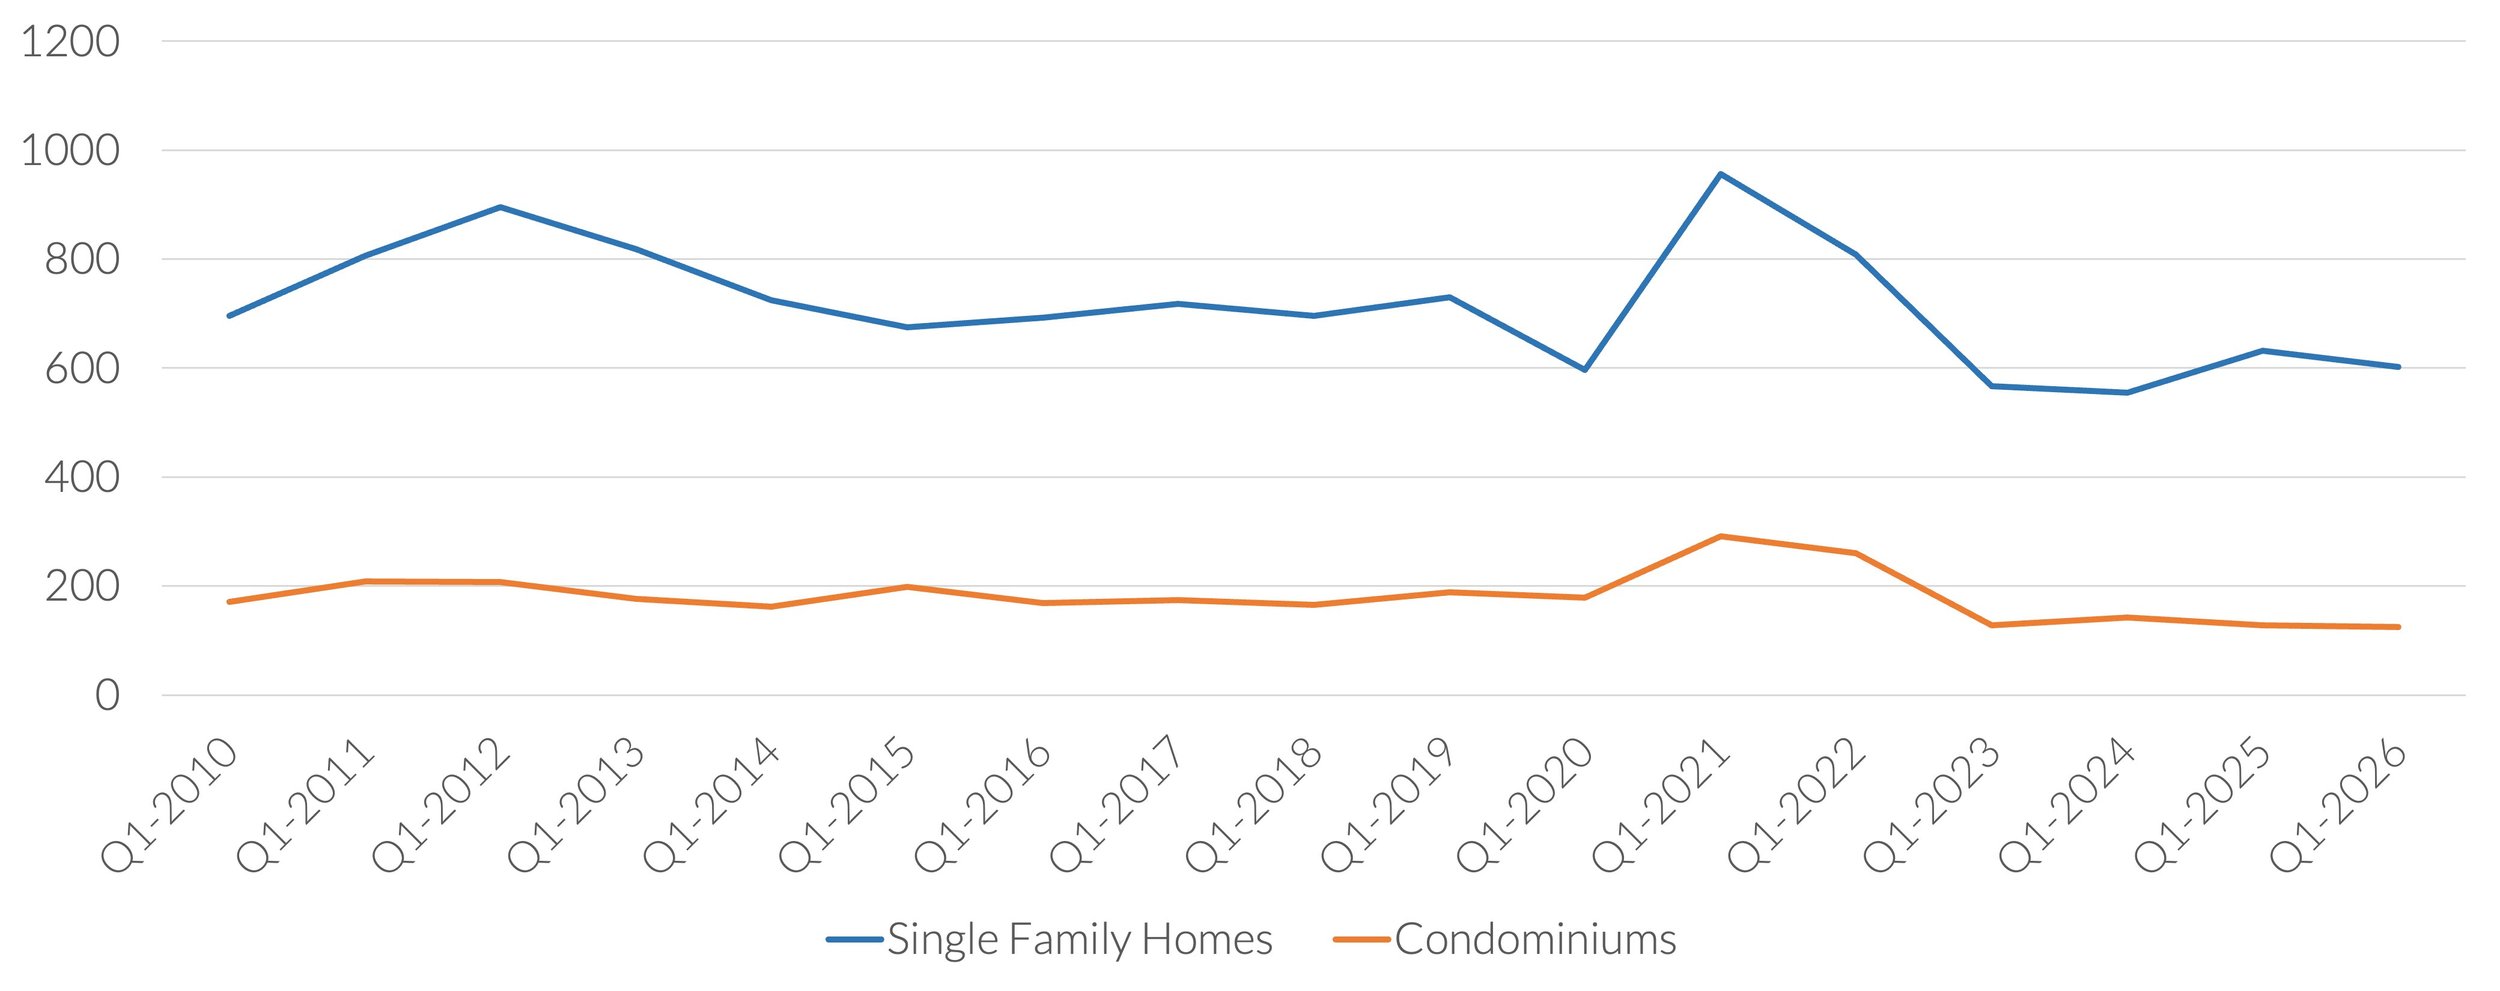
602
-4.7% change year-over-year
125
-2.3% change year–over–year
SEE ALL AVAILABLE REPORTS: